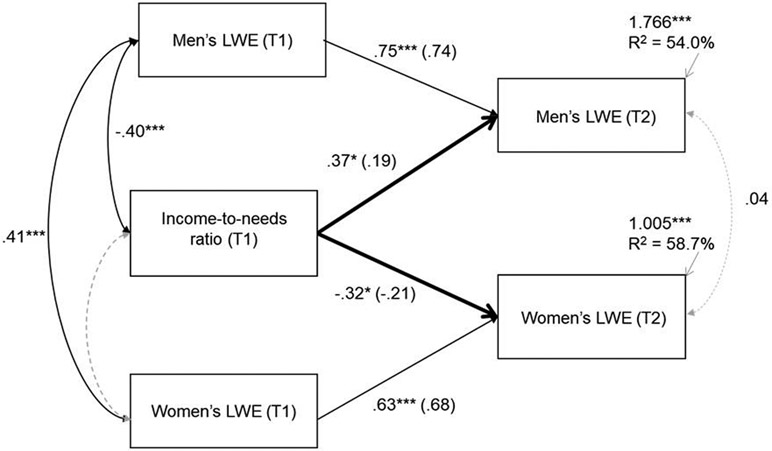
Figure 2.
Solid bold lines represent significant actor/partner pathways, solid lines represent significant paths, and dashed lines indicate non-significant pathways. Unstandardized and standardized (in parentheses) coefficients are provided for pathways. Correlations are provided for covarying pathways. All models control for age, race, medication use, cohabitation length, season of assessment, and autoregressive sleep effects (T1).
Note: * p < .05, ** p < .01, *** p < .001; LWE = long wake episodes.

