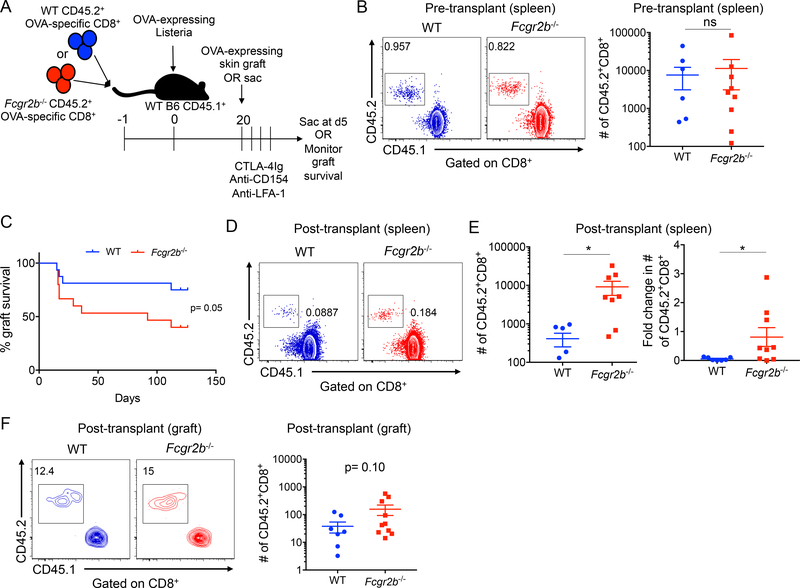
Figure 4: FcγRIIB expression on memory CD8+ T cells modulates costimulation and integrin blockade resistance.
WT OVA-specific CD45.2+ CD8+ T cells (WT OT-I) or Fcgr2b−/− OVA-specific CD45.2+ CD8+ T cells (Fcgr2b−/− OT-I) were harvested from the spleen and adoptively transferred into WT CD45.1+ C57BL/6 hosts that were then infected with Listeria. A) Schematic of experimental design. B) Representative flow plots of WT and Fcgr2b−/− OT-I T cells (gated on CD8+) in the spleen on day 22 post infection. Summary data is also shown (due to logarithmic axis, zero values are not shown: 3 for WT, 1 for Fcgr2b−/−). Pooled data from two independent experiments, n=4–5 mice per group. Mann-Whitney T test was performed, ns=nonsignificant. C) On day 20, mice were grafted with OVA-expressing skin grafts and treated with 250ug CTLA-4Ig, anti-CD154 (MR-1), and anti-LFA-1 on days 0, 2, 4 and 6 and graft survival was monitored. Log-rank (Mantel-Cox) test was performed, p=0.05. D-F: On day 20, mice were grafted with OVA-expressing skin grafts and then sacrificed on day 5 and spleen and skin grafts were harvested. D) Representative flow plots of WT and Fcgr2b−/− CD45.2+ OT-I (gated on CD8+ T cells) from the spleen on day 5 post grafting. E) Summary data of the absolute cell number on day 5 and the fold change from day 22 in (B) to day 5 of WT and Fcgr2b−/− CD45.2+ OT-I from the spleen post grafting. Due to logarithmic axis, zero values are not shown: 2 for WT, 1 for Fcgr2b−/−. Pooled data from two independent experiments, n=4–5 mice per group. Mann-Whitney T test was performed, *p<0.05. F) Representative flow plots of WT and Fcgr2b−/− CD45.2+ OT-I (gated on CD8+ T cells) from the skin graft on day 5 post grafting. Summary data is also shown of the absolute cell number of WT and Fcgr2b−/− CD45.2+ OT-I from the skin graft on day 5 post grafting. Due to logarithmic axis, zero values are not shown: 1 for WT. Pooled data from two independent experiments, n=4–5 mice per group. Mann-Whitney t test was performed, p=0.10.

