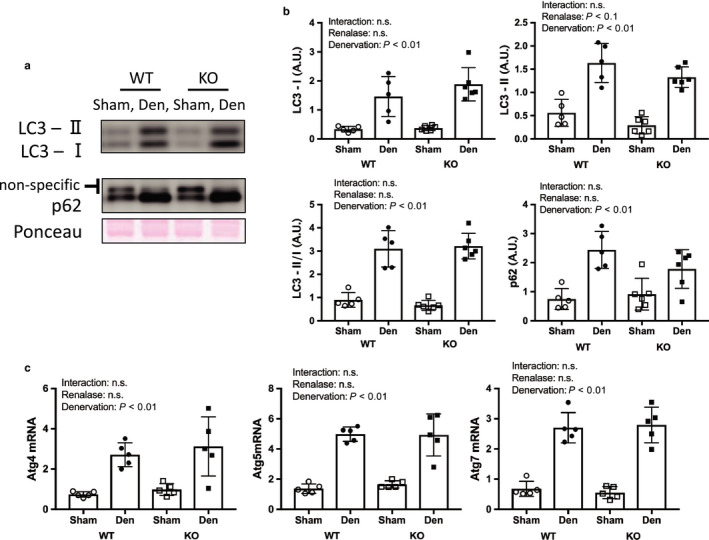
FIGURE 6.

Autophagy pathway by denervation induced muscle atrophy between WT and KO mice. (a) Image of p62 and LC3 in western blotting (b) Quantitative amount of these image in the gastrocnemius muscle by denervation. (c) mRNA expression related to autophagy pathway. Data are shown as mean ± SD. n = 5 in WT group, n = 6 in KO group. WT, wild‐type; KO, knock out‐type; Sham, sham‐operated control; DEN, denervation
