
Fig. 1.
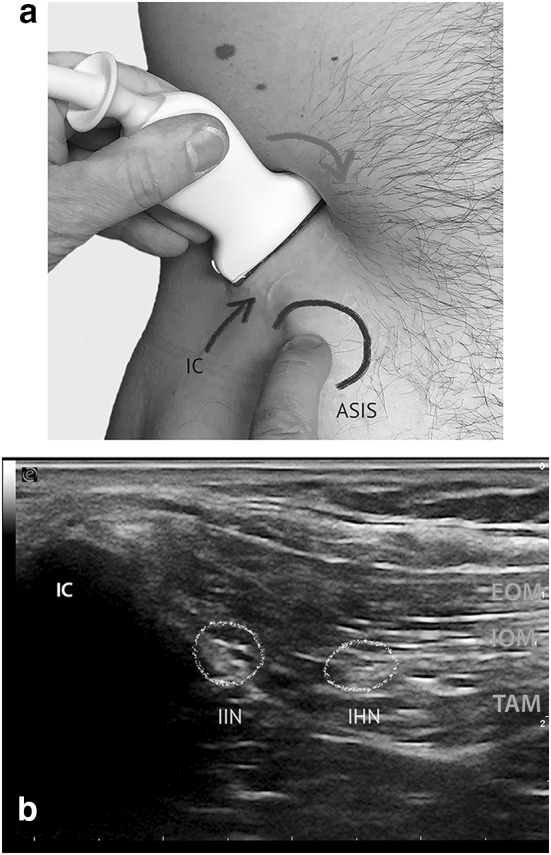
Probe placement for high-resolution ultrasonographic visualization of IHN and I-IN (ESAOTE, Italy, 13 MHz, linear array probe). a The arrow indicates the probe movement. The ASIS (black circle) and IC as landmarks. b Ultrasonographic image of I-IN and IHN obtained by the probe position. I-IN and IHN (yellow circles) lying in between the Internal oblique (IOM) and Transversal abdominal muscle (TAM). IC iliac crest