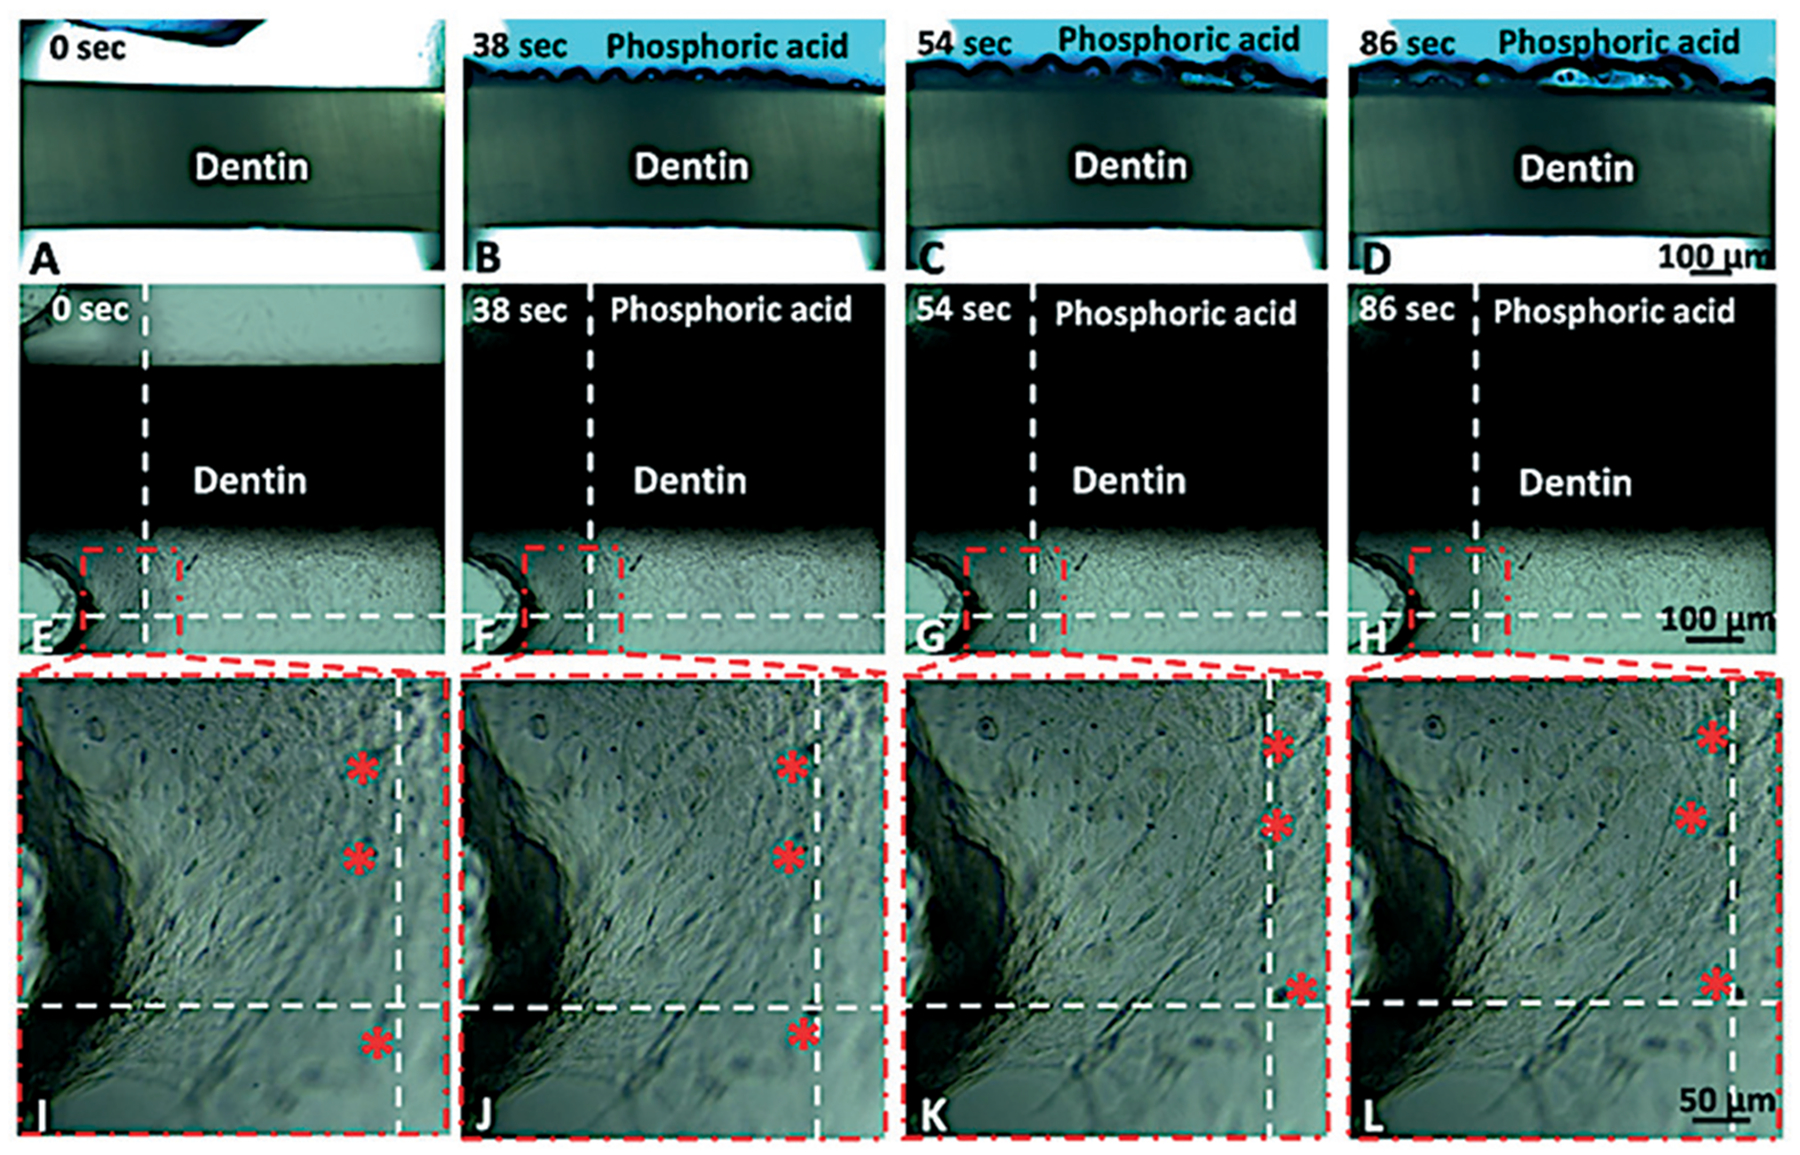
Fig. 3.

Time-lapse showing the process of dentin acid etching with 35% phosphoric acid for 86 seconds. Figures A–D show live imaging of the acid interacting with the dentin tissue (cells are not seen due to the intensity of light). Figures E–L present the same process with low light intensity to show the cell monolayer as the dentin is acid etched. Figures I–L show what appears to be the contraction of cells in the monolayer as a function of exposure to phosphoric acid. Red asterisks show cells that appear to move relative to the dotted lines, which are provided as reference. Using the scale bar as reference, cells appear to move approximately 50 μm over the course of 86 seconds (ESI,† Movie S4).
