
Fig. 1.
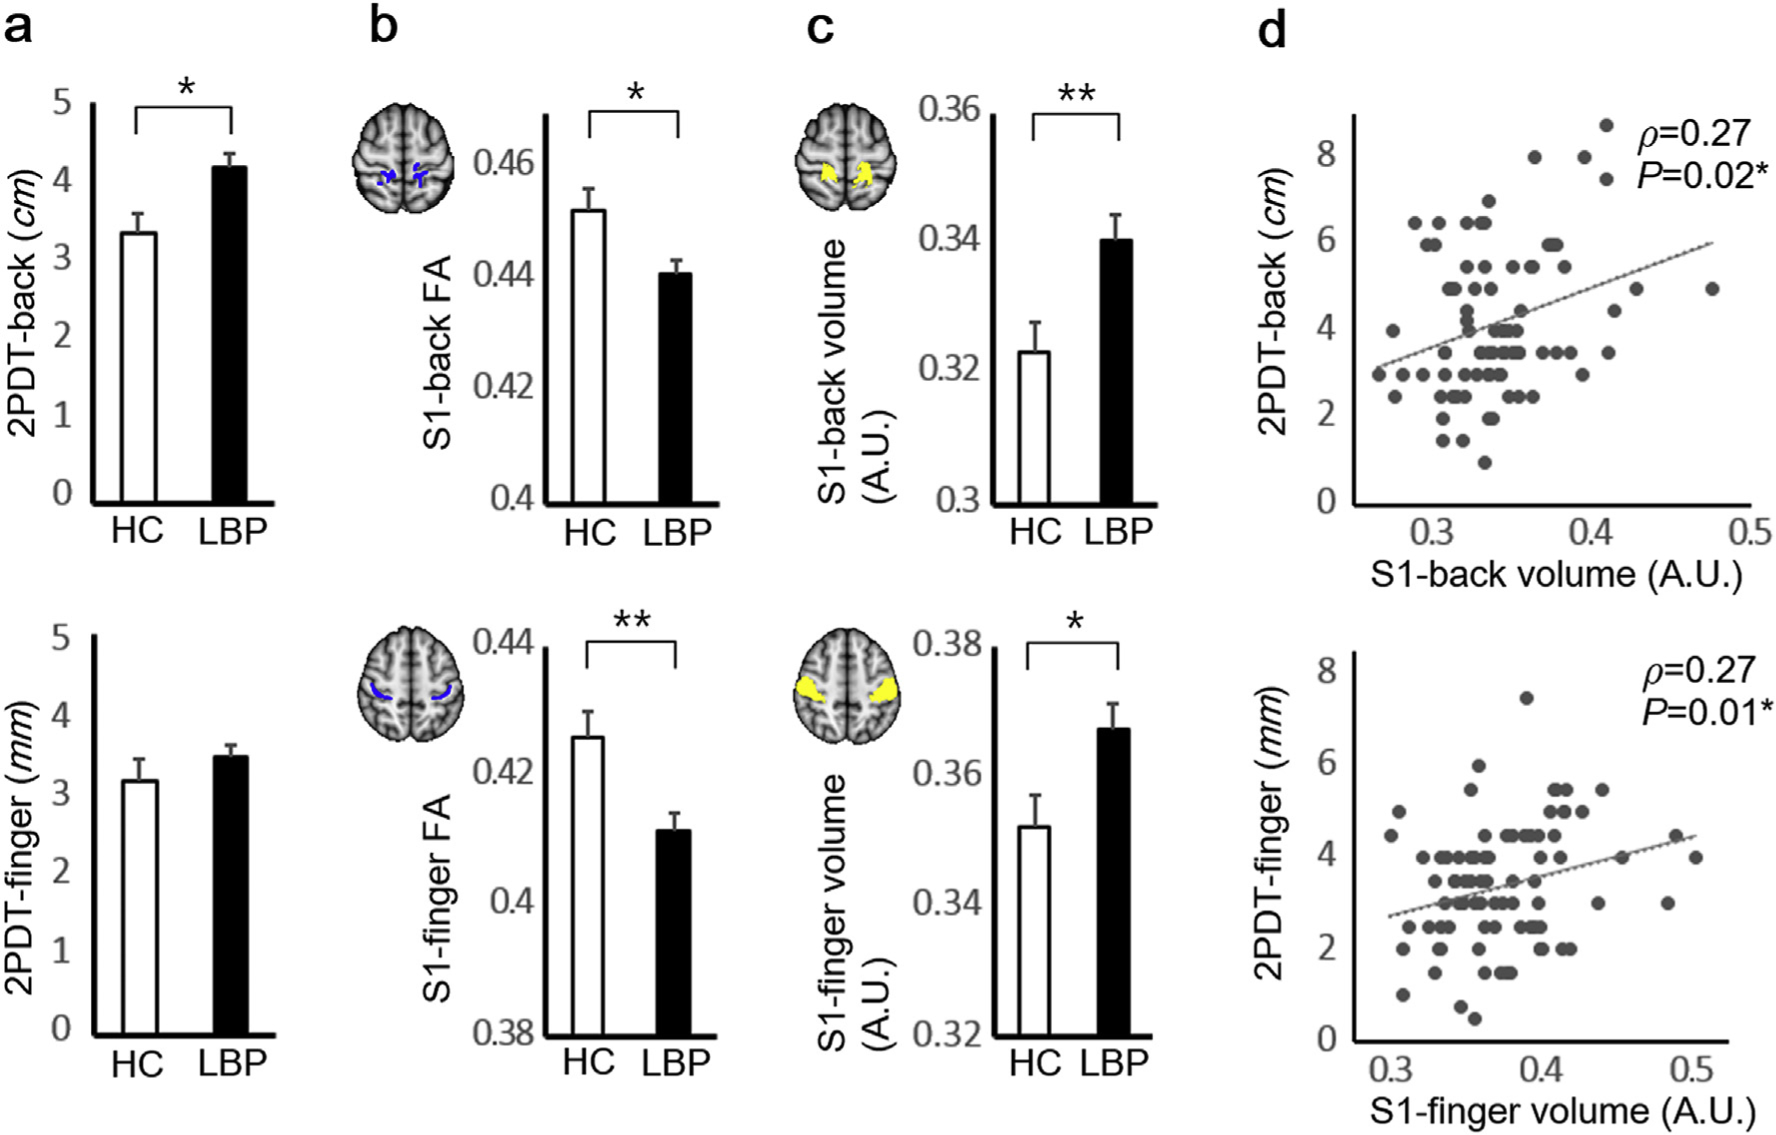
(a) The 2PDT-back but not 2PDT-finger scores were greater (worse tactile acuity) for cLBP compared to HC. (b) Mean FA in white matter adjacent to back and finger ROIs (blue color for white matter skeleton) was reduced in cLBP compared to HC. (c) S1 gray matter volume was increased for cLBP in both back (z = 60 mm) and finger (z = 53 mm) S1 cortical representation ROIs (yellow color) (d) For cLBP, worse 2PDT scores for back and finger locations were associated with greater gray matter volume in back and finger S1 representation ROIs, respectively. No significant associations were found for HC. *P < 0.05, **P < 0.01. Error bars represent SEM. Abbreviations: 2PDT = two-point discrimination threshold, A.U. = arbitrary unit, cLBP = chronic low back pain patients, HC = healthy controls, FA = fractional anisotropy, S1 = primary somatosensory cortex.