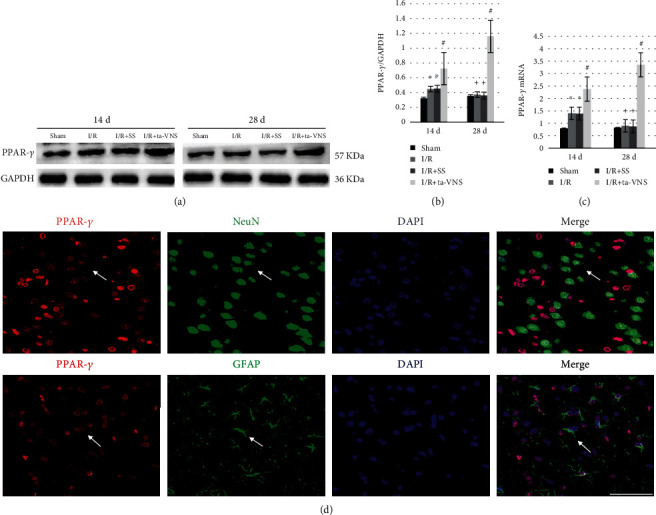
Figure 1.

PPAR-γ expression in the peri-infarct cortex is upregulated by ta-VNS treatment. (a) Representative western blot images of PPAR-γ expression induced by ta-VNS at 14 and 28 d after MCAO/R. (b) Comparison of mean intensity ratios in western blot analysis for PPAR-γ expression.(∗P < 0.05 vs sham group, #P < 0.05 vs I/R and I/R+SS groups, +P > 0.05 vs sham group). (c) qPCR analysis showing PPAR-γ gene expression induced by ta-VNS at 14 and 28 d after MCAO/R. (∗P < 0.05 vs sham group, #P < 0.05 vs I/R and I/R+SS groups, +P > 0.05 vs sham group). (d) Immunofluorescence staining for PPAR-γ (red), GFAP/NeuN (green), and cellular nuclei (blue) at 28 d after reperfusion. Arrows show the positive cells. Scale bar = 50 μm.
