
Figure 3.
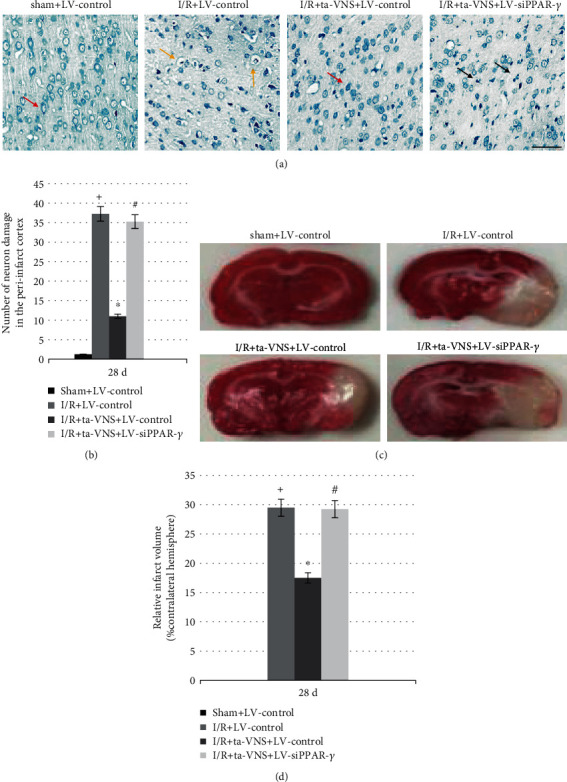
Inhibition of PPAR-γ attenuates the ta-VNS-mediated suppression of neuronal damage and infarction volume enlargement at 28 d after MCAO/R. (a) Representative images of nissl staining results in each group (scale bar = 50 μm). Red arrows represent normal neuron, yellow arrows represent perinuclear vacuolization, and black arrows represent pyknotic nuclei. (b) The number of neuron damage in the peri-infarct cortex was represented in the bar graph. (c) Representative images of infarction volume in each group. (d) The measure of infarct volume was reflected in the bar graph at 28 d after stroke (+P < 0.05 vs sham+LV-control group, ∗P < 0.05 vs I/R+LV-control group, and #P < 0.05 vs I/R+ta-VNS+LV-control group).