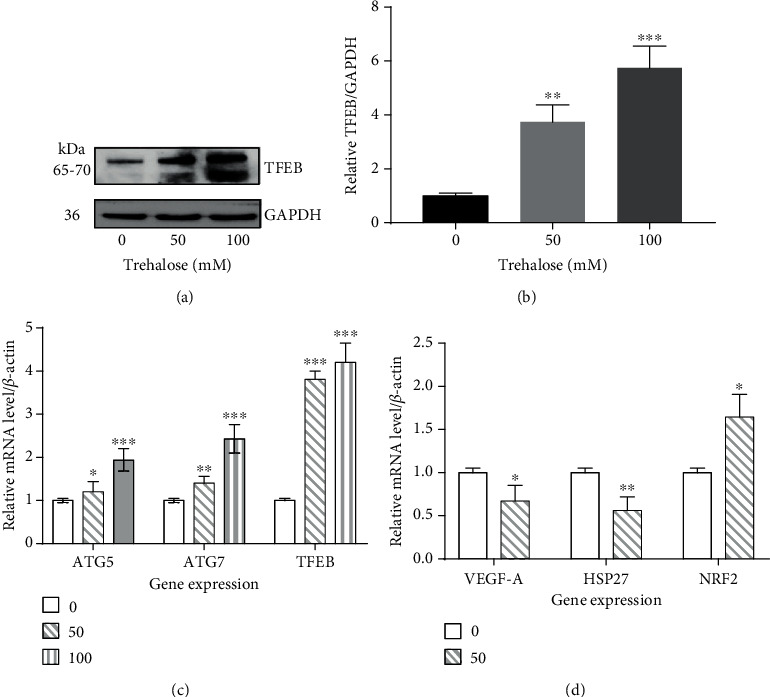
Figure 6.

Changes in the mRNA and/or protein levels in the autophagy-lysosomal pathway and oxidative stress. (a, b) Immunoblot showing an increase in the expression of TFEB in whole-cell lysate by trehalose. (c, d) RT-qPCR showing transcriptional changes in autophagy genes ATG5 and ATG7 and oxidative stress pathway targets, including NRF2, HSP 27, and VEGF-A. Data represent the mean ± SD of 3 independent experiments. Statistical analysis was performed using either unpaired t test or one-way ANOVA test, followed by Dunnett's post hoc test; ∗p < 0.05, ∗∗p < 0.01, ∗∗∗p < 0.001.
