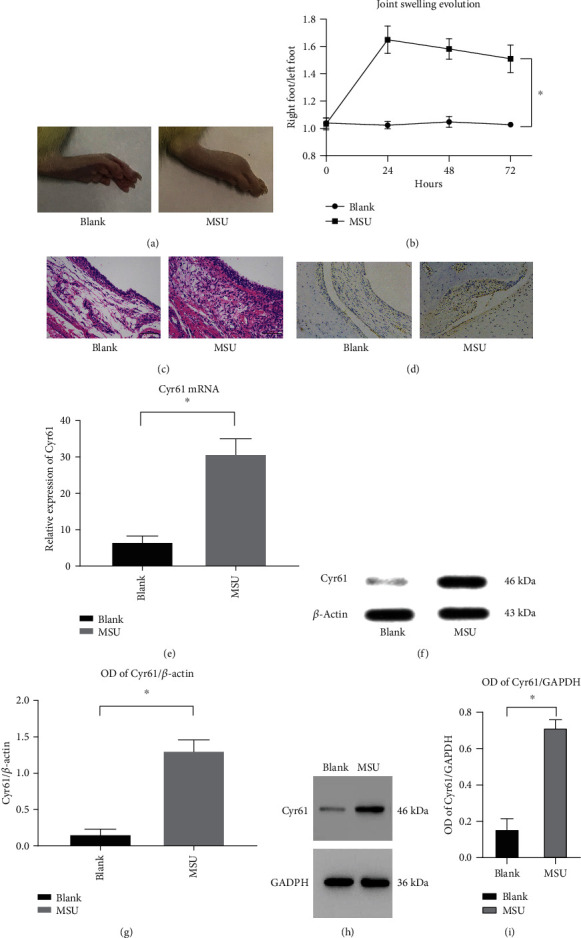
Figure 1.

(a) The pictures of arthritis from the blank group and MSU-induced murine gout model group after 72 h. (b) The ratio of the right foot to the left foot (normal control) from 0 h to 72 h (∗P < 0.05). (c) H&E staining of synovial tissue from the blank group and MSU-induced murine gout model group. (d, f) Immunohistochemical staining of Cyr61, relative expression of Cyr61 mRNA, and the protein level of Cyr61 in the synovial tissue from the same groups (∗P < 0.05). (g) Protein level in different groups was expressed as a ratio to β-actin (∗P < 0.05). (h) The protein level of Cyr61 in the rat FLS from the same groups. (i) Protein level in different groups was expressed as a ratio to GAPDH (∗P < 0.05).
