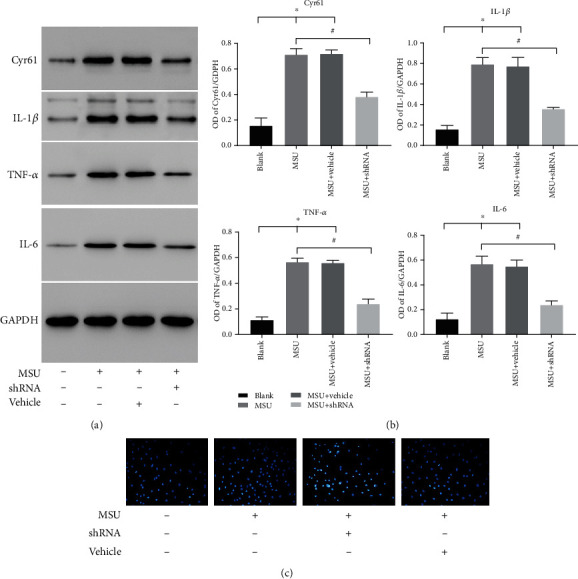
Figure 5.

(a) Protein levels of Cyr61, IL-1β, IL-6, and TNF-α in the blank or MSU-induced groups with or without shRNA interference. (b) Protein levels in different groups were expressed as a ratio to GAPDH (∗P < 0.05, vs. blank; #P < 0.05, vs. MSU-induced). (c) Hoechst staining of rat FLS in the same groups.
