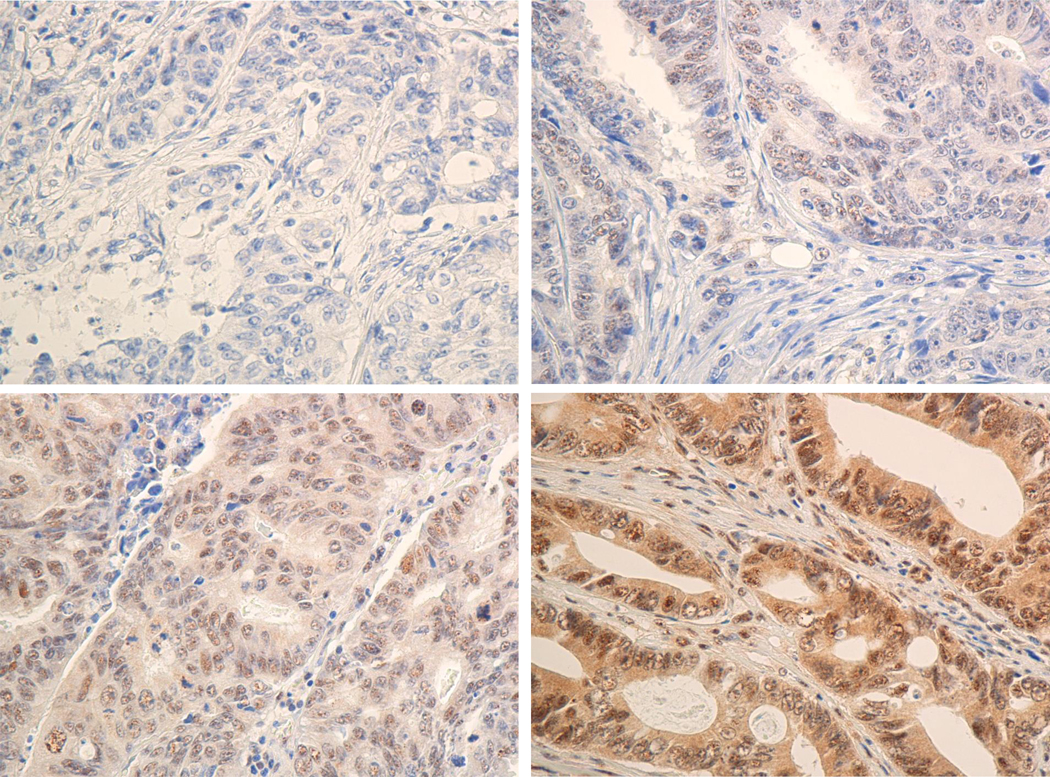
Figure 2. Inmunohistochemical evaluation of TFAP2E expression.

Inmunohistochemical staining with a polyclonal anti-TFAP2E antibody was broken down into 2 categories in CRC epithelial cells: positive (B, C & D) and negative (A) TFAP2E expression. Positive samples were estimated on scales of 1 to 3 depending of the intensity of tumor cells staining on each slide. (B) Score 1 for CRC epithelial cells with weak and heterogeneous positive TFAP2E expression (C) Score 2 for CRC epithelial cells with strong and heterozygous positive TFAP2E expression and score 3 (D) CRC epithelial cells with strong and homozygous positive TFAP2E expression. Left panels show 40X amplification, right panels show 20X amplification.
