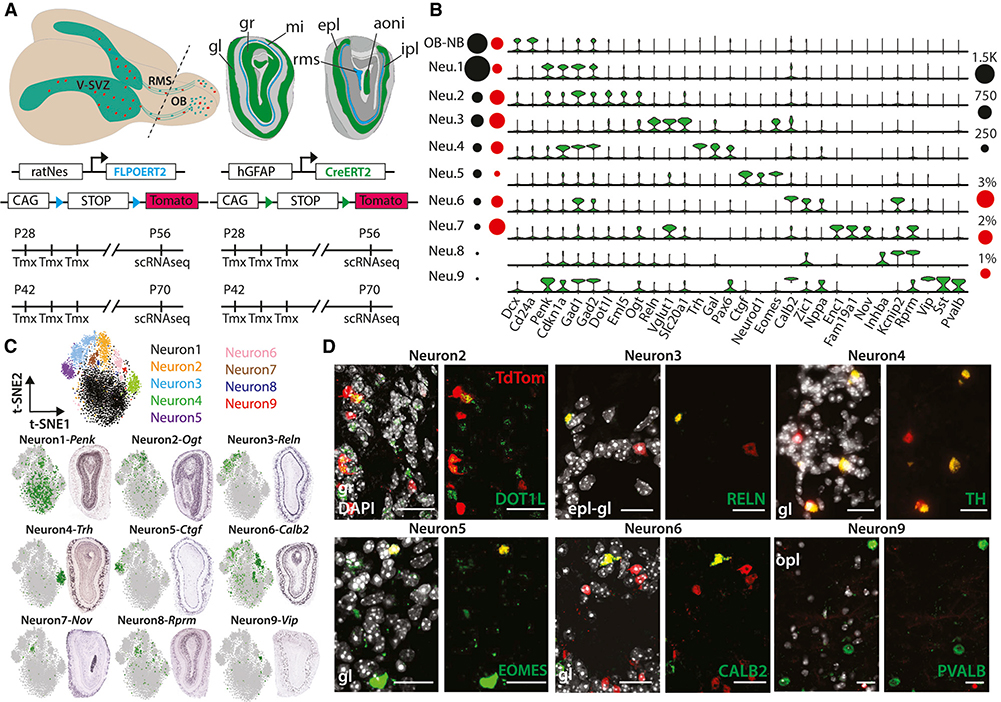
Figure 1. Fate-Mapping Experiments and OB Neuron Subtypes.
(A) Top: schema of adult mouse brain (left) showing the migration of V-SVZ neuronal precursors (red) to the OB. Coronal schema (right) highlighting the main OB layers (gl, glomerular layer; gr, granule cell layer; mi, mitral cell layer; epl, external plexiform layer; ipl, internal plexiform layer), anterior olfactory nucleus (aoni), and RMS, which terminates in the subependymal zone (RMS/SEZ). Bottom: four- and six-week-old GCERT2 and NESFLPO animals were injected with tamoxifen for three consecutive days and assayed four weeks after the last injection.
(B) Violin plots showing log2 (counts per million [CPM] + 1) expression values of neuron subtype markers (false discovery rate [FDR] < 0.05). Black and red circles indicate cell numbers and fraction of TdTom+ cells, respectively, in each cluster.
(C) Top: t-distributed stochastic neighbor embedding (t-SNE) of major OB neurons colored separately. Bottom: ISH images showing spatial distribution of subtype markers and their scaled expression on t-SNE.
(D) Coronal images showing the co-localization of endogenous TdTom and main OB neuron subtype markers. The corresponding OB layer was indicated on each image. Scale bars: 20 μm.

