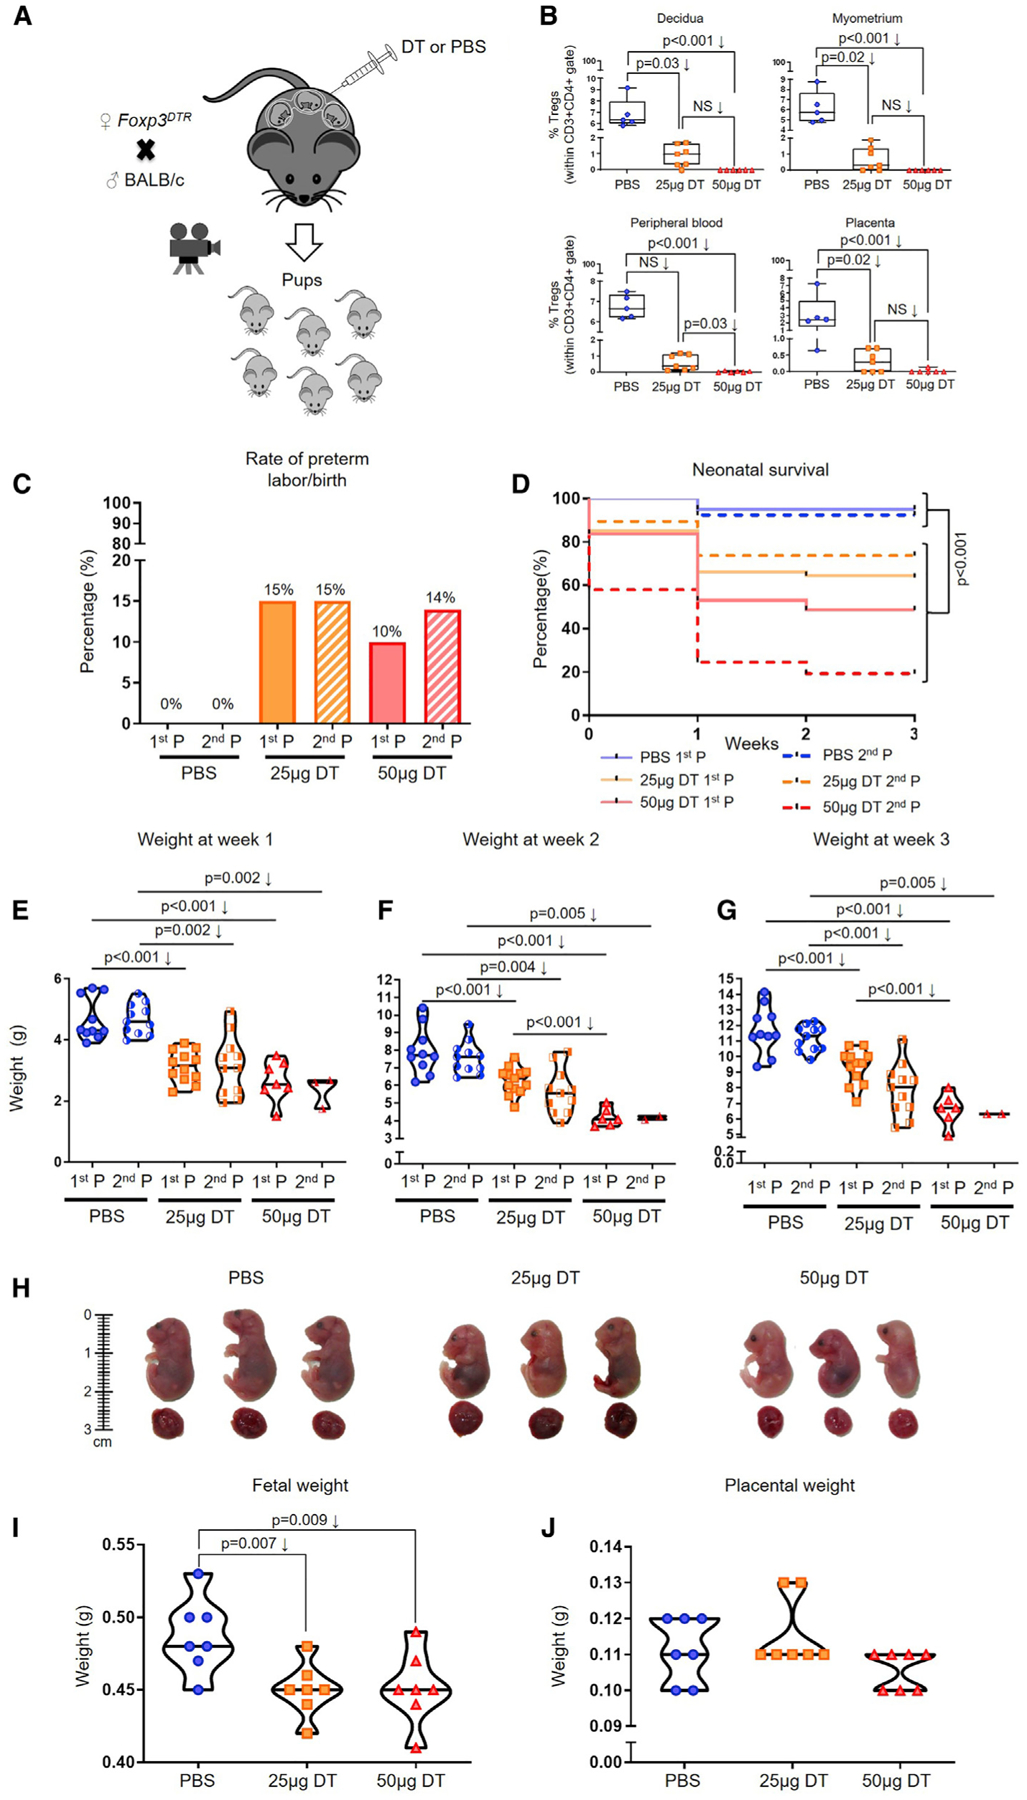
Figure 3. Depletion of Tregs Induces a Fraction of Preterm Births and Adverse Neonatal Outcomes.

(A) Foxp3DTR dams underwent partial or total Treg depletion. Controls were injected with sterile 13 PBS. After the first pregnancy (P), a subset of Foxp3DTR dams underwent a second P and were again partially or totally Treg-depleted or were injected with sterile 13 PBS.
(B) Frequencies of Tregs in the decidua, myometrium, peripheral blood, and placenta of partially or totally Treg-depleted Foxp3DTR dams (n = 5–7 per group). Data are represented as medians with interquartile and minimum/maximum ranges.
(C) Preterm birth rates of non-Treg-depleted-, partially Treg-depleted-, and totally Treg-depleted-Foxp3DTR dams (1st or 2nd P, n = 9–20 per group). Data are represented as means of percentages.
(D) Percentage of survival from birth until 3 weeks postpartum for neonates born to non-Treg-depleted-, partially Treg-depleted-, and totally Treg-depleted-Foxp3DTR dams (1st or 2nd P, n = 7–18 per group).
(E–G) Weights of neonates born to non-Treg-depleted-, partially Treg-depleted-, and totally Treg-depleted-Foxp3DTR dams at weeks (E) 1, (F) 2, and (G) 3 postpartum (1st or 2nd P, n = 2–12 litters per group). Data are represented as violin plots with medians and minimum/maximum ranges.
(H) Representative images of fetuses (and their placentas) from non-Treg-depleted-, partially Treg-depleted-, and totally Treg-depleted-Foxp3DTR dams (n = 8–9 per group).
(I and J) Weights of (I) fetuses and (J) their placentas from non-Treg-depleted-, partially Treg-depleted-, and totally Treg-depleted-Foxp3DTR dams (n = 7 litters per group).
Statistical analysis was performed using the Mantel-Cox test for survival curves, and Kruskal-Wallis or ANOVA tests with correction for multiple comparisons. See also Figures S1–S4.
