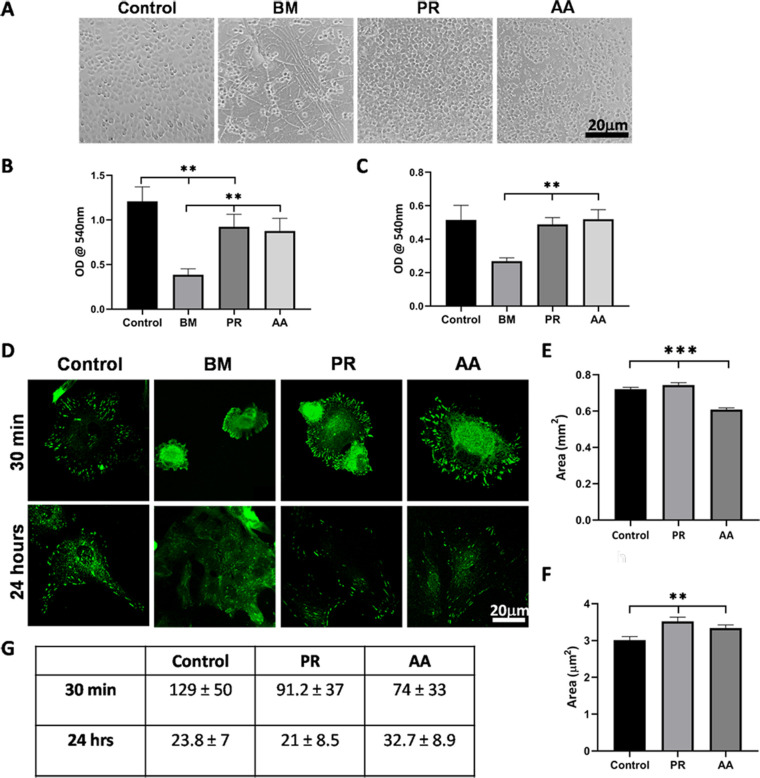
Figure 7.
Quantificationof CE cell adhesion to silk films. (A) Representative images of cells adhered to the different silk films and FNC coated dish after 30 minutes. (B) Graph representing the adhesion of primary CE cells to the different varieties of silk films from the same batch. (C) Graph representing the adhesion of HCE-21T cell line to different batches of silk films. (D) Representative images of cells stained for paxillin at 30 minutes and 24 hours after seeding. (E) Graph showing the average area of FAs after 30 minutes of seeding and (F) at 24 hours after seeding. (G) Table of the average number of FAs at 30 minutes and 24 hours of seeding cells (**P < 0.01; ***P < 0.001).

