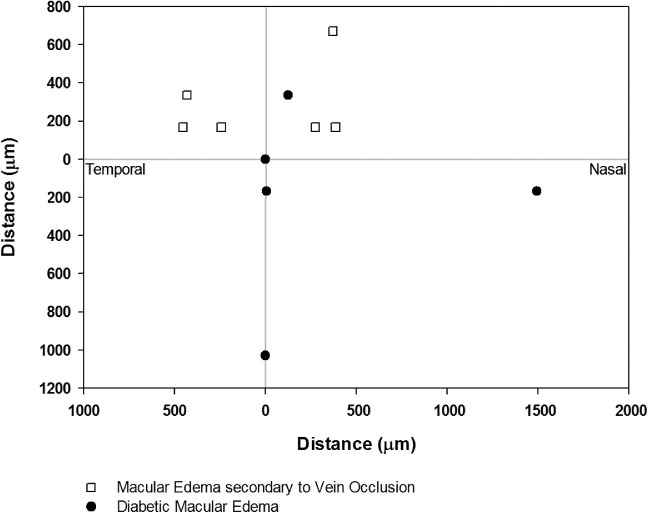
Figure 3.
Distribution of the peak points (P) of the macular edema. Most of the peak points were located nasal (6 of 11 eyes, 54.5%) and superior (7 of 11 eyes, 63.6%) to the foveola. There was no difference in the proximity of the peak points to the foveola among eyes with macular edema secondary to diabetic retinopathy and branch retinal vein occlusion (P = 0.93).

