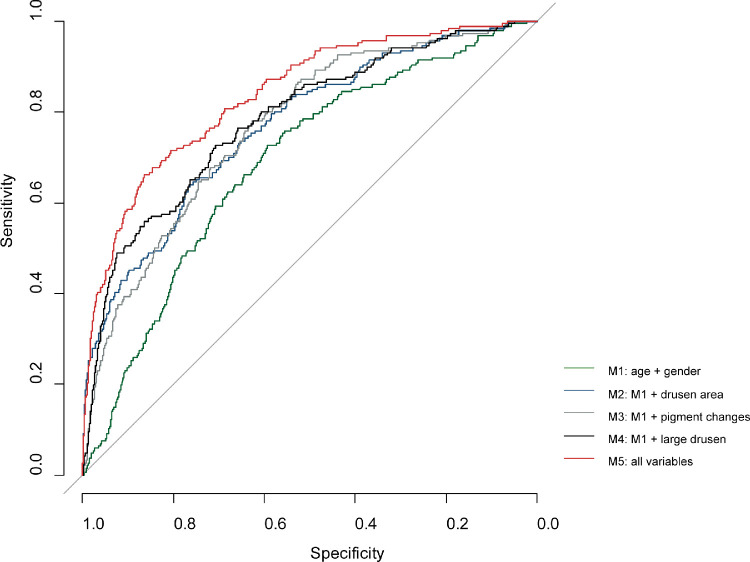
Figure 7.
ROC curve of various prediction models of incident late AMD. M1 = age + sex; M2 = age + sex + drusen area ≥10% in the ETDRS grid; M3 = age + sex + pigment changes; M4 = age + sex + drusen size ≥ 125 µm; M5 = age + sex + drusen area ≥10% in the ETDRS grid + pigment changes + drusen ≥ 125 µm.

