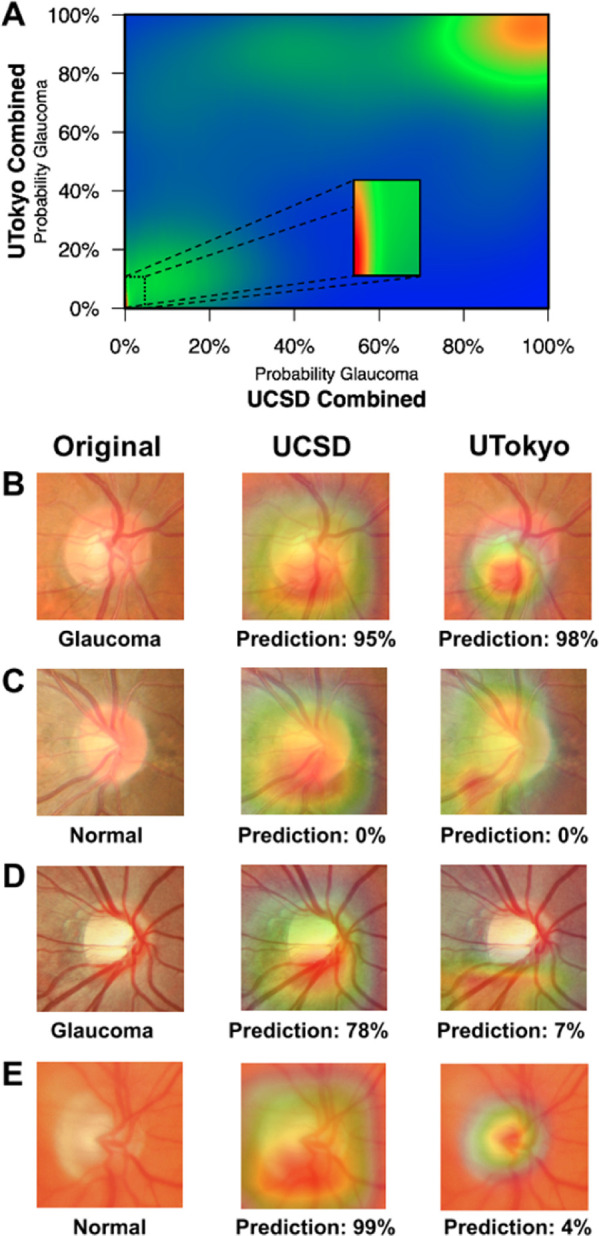
Figure.

Case examples illustrating good and poor levels of agreement between the UCSD and UTokyo combined deep learning models. (A) A heat map showing the density of predictions from the combined UCSD and UTokyo models. Examples of both models agreeing on a correct classification of a glaucoma (B) and normal (C) images are provided along with the predicted probabilities of glaucoma from the combined models. Similar examples are shown for cases when the models disagreed about a glaucoma (D) and normal (E) image. In (B–E), the original fundus image (left) is shown along with a class activation map identifying informative regions used by the UCSD combined (middle) and UTokyo combined (right) models.
