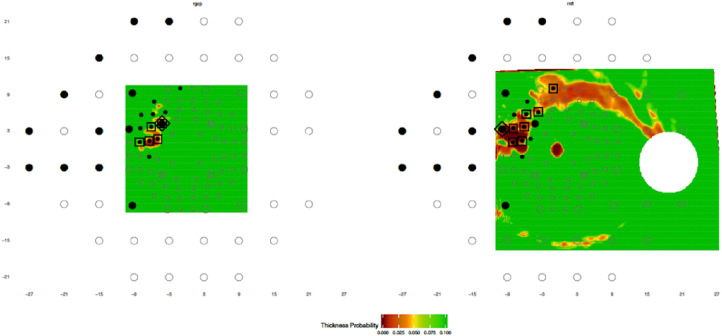
Figure 4.
The maps as in Figure 2 for an eye (DG) with early glaucoma that shows aS-aF agreement in both the RGC+ (A) and the RNFL (B) probability plots. If a criterion of “OCT <10% and VF <5%” is applied, this eye shows five aS-aF locations in the RGC+ and eight in the RNFL.

