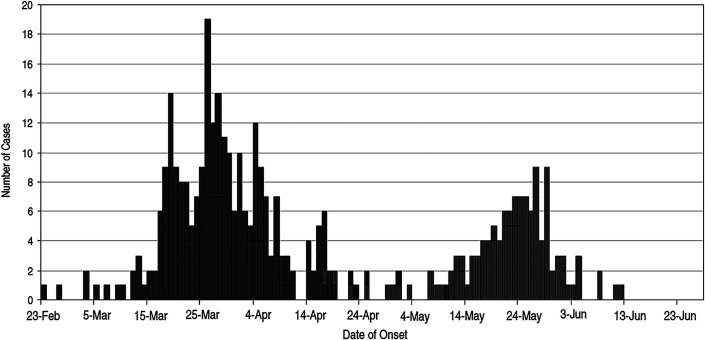
Fig. 1.
Double curve during the SARS outbreak in Toronto in 200346. Illustration of the double curve, or second wave, of infection that can occur in pandemics if appropriate measures are not adhered to when the threat of the pandemic is lessening. (Republished, with permission of The National Academies Press, from: SARS: lessons from Toronto, Low DE, in: Learning from SARS: preparing for the next disease outbreak: workshop summary, Institute of Medicine [U.S.] Forum on Microbial Threats; Knobler S, Mahmoud A, Lemon S, Mack A, Sivitz L, Oberholtzer K, editors. 2004; permission conveyed through Copyright Clearance Center, Inc.)

