
Figure 3.
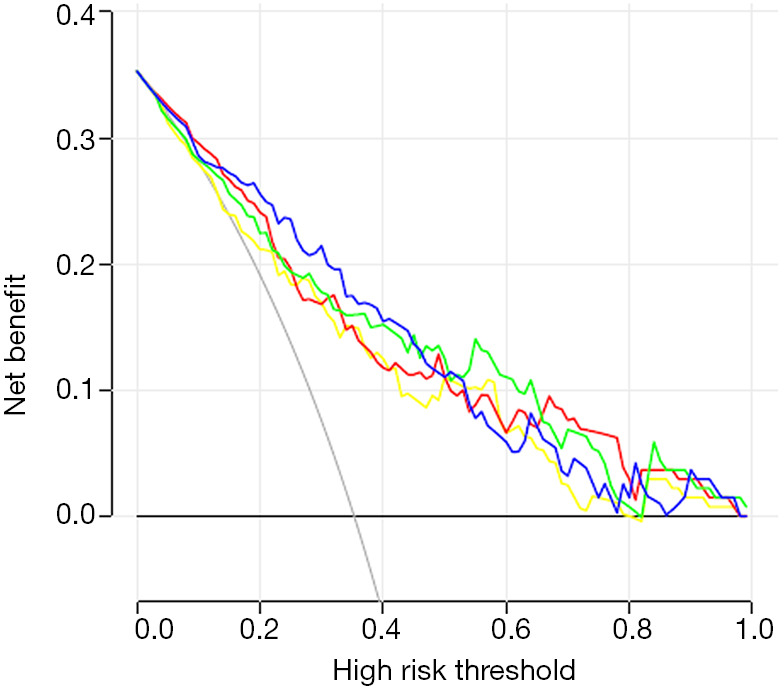
Analysis of imaging features and clinical and pathological features by a decision curve nomogram. The red, green, blue and yellow lines represent the nomograms from models 1, 2, 3 and 4 respectively. The light gray line represents the hypothesis that all clinicopathological and imaging features are related to postoperative survival time. The dark gray line indicates that there is no hypothesis that all clinicopathological and imaging features are related to postoperative survival.