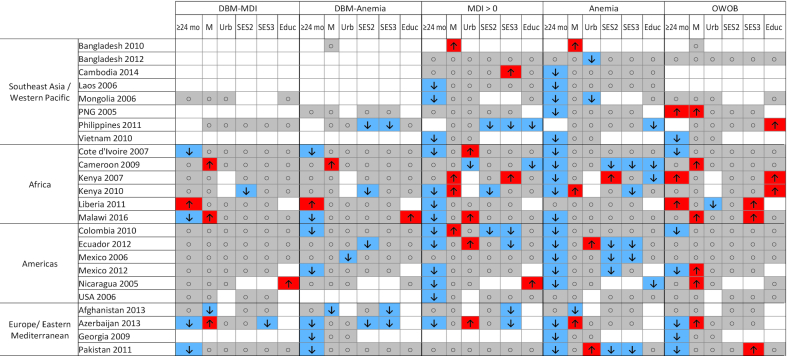
FIGURE 2.
Patterns of associations between the DBM, micronutrient deficiency, anemia, and OWOB. Blue cells with the “down” arrow indicate smaller odds of the outcome (P < 0.05), red cells with the “up” arrow indicate greater odds of the outcome (P < 0.05), gray cells with the circle indicate no significant association (P ≥ 0.05), and white cells indicate that the relation was not assessed owing to missing data. Results reflect logistic regression analysis (SAS proc surveylogistic) with all predictor variables included in each model. Analysis of predictors of DBM-MDI and DBM-Anemia was not conducted for surveys with n < 10 cases of the outcome (DBM-MDI: Bangladesh 2010, Bangladesh 2012, Cambodia, Georgia, Laos, PNG, Vietnam; DBM-Anemia: Bangladesh 2012, Cambodia, Laos, Mongolia, USA, Vietnam). DBM, double burden of malnutrition; DBM-Anemia, double burden of malnutrition, defined as overweight/obesity and anemia; DBM-MDI, double burden of malnutrition, defined as overweight/obesity and ≥1 micronutrient deficiency; Educ, secondary or higher caregiver or head of household education (reference: no or primary education); M, male sex (reference: female sex); MDI, Micronutrient Deficiency Index; OWOB, overweight or obesity; PNG, Papua New Guinea; SES2, medium socioeconomic status (reference: low socioeconomic status); SES3, high socioeconomic status (reference: low socioeconomic status); Urb, urban household location (reference: rural household location); ≥24 mo, child age 24–59 mo (reference: age 6 to <24 mo).

