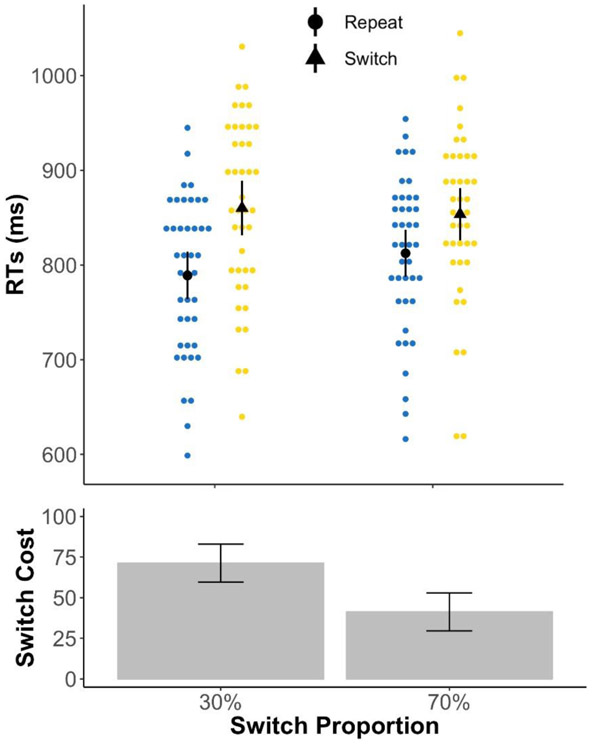
Figure 3.
Experiment 2 mean RTs and switch costs collapsed across three tasks. Upper panel depicts group mean RTs in black circles (repeat) and triangles (switch) and individual mean RTs in blue (repeat) and yellow (switch) dots. Lower panel depicts mean switch costs in bars. All error bars indicate confidence intervals (1.96 × standard error). Switch cost in the 30% switch condition was significantly greater than the 70% condition.

