
Figure 1. VIC activation is regulated by biochemical cues.
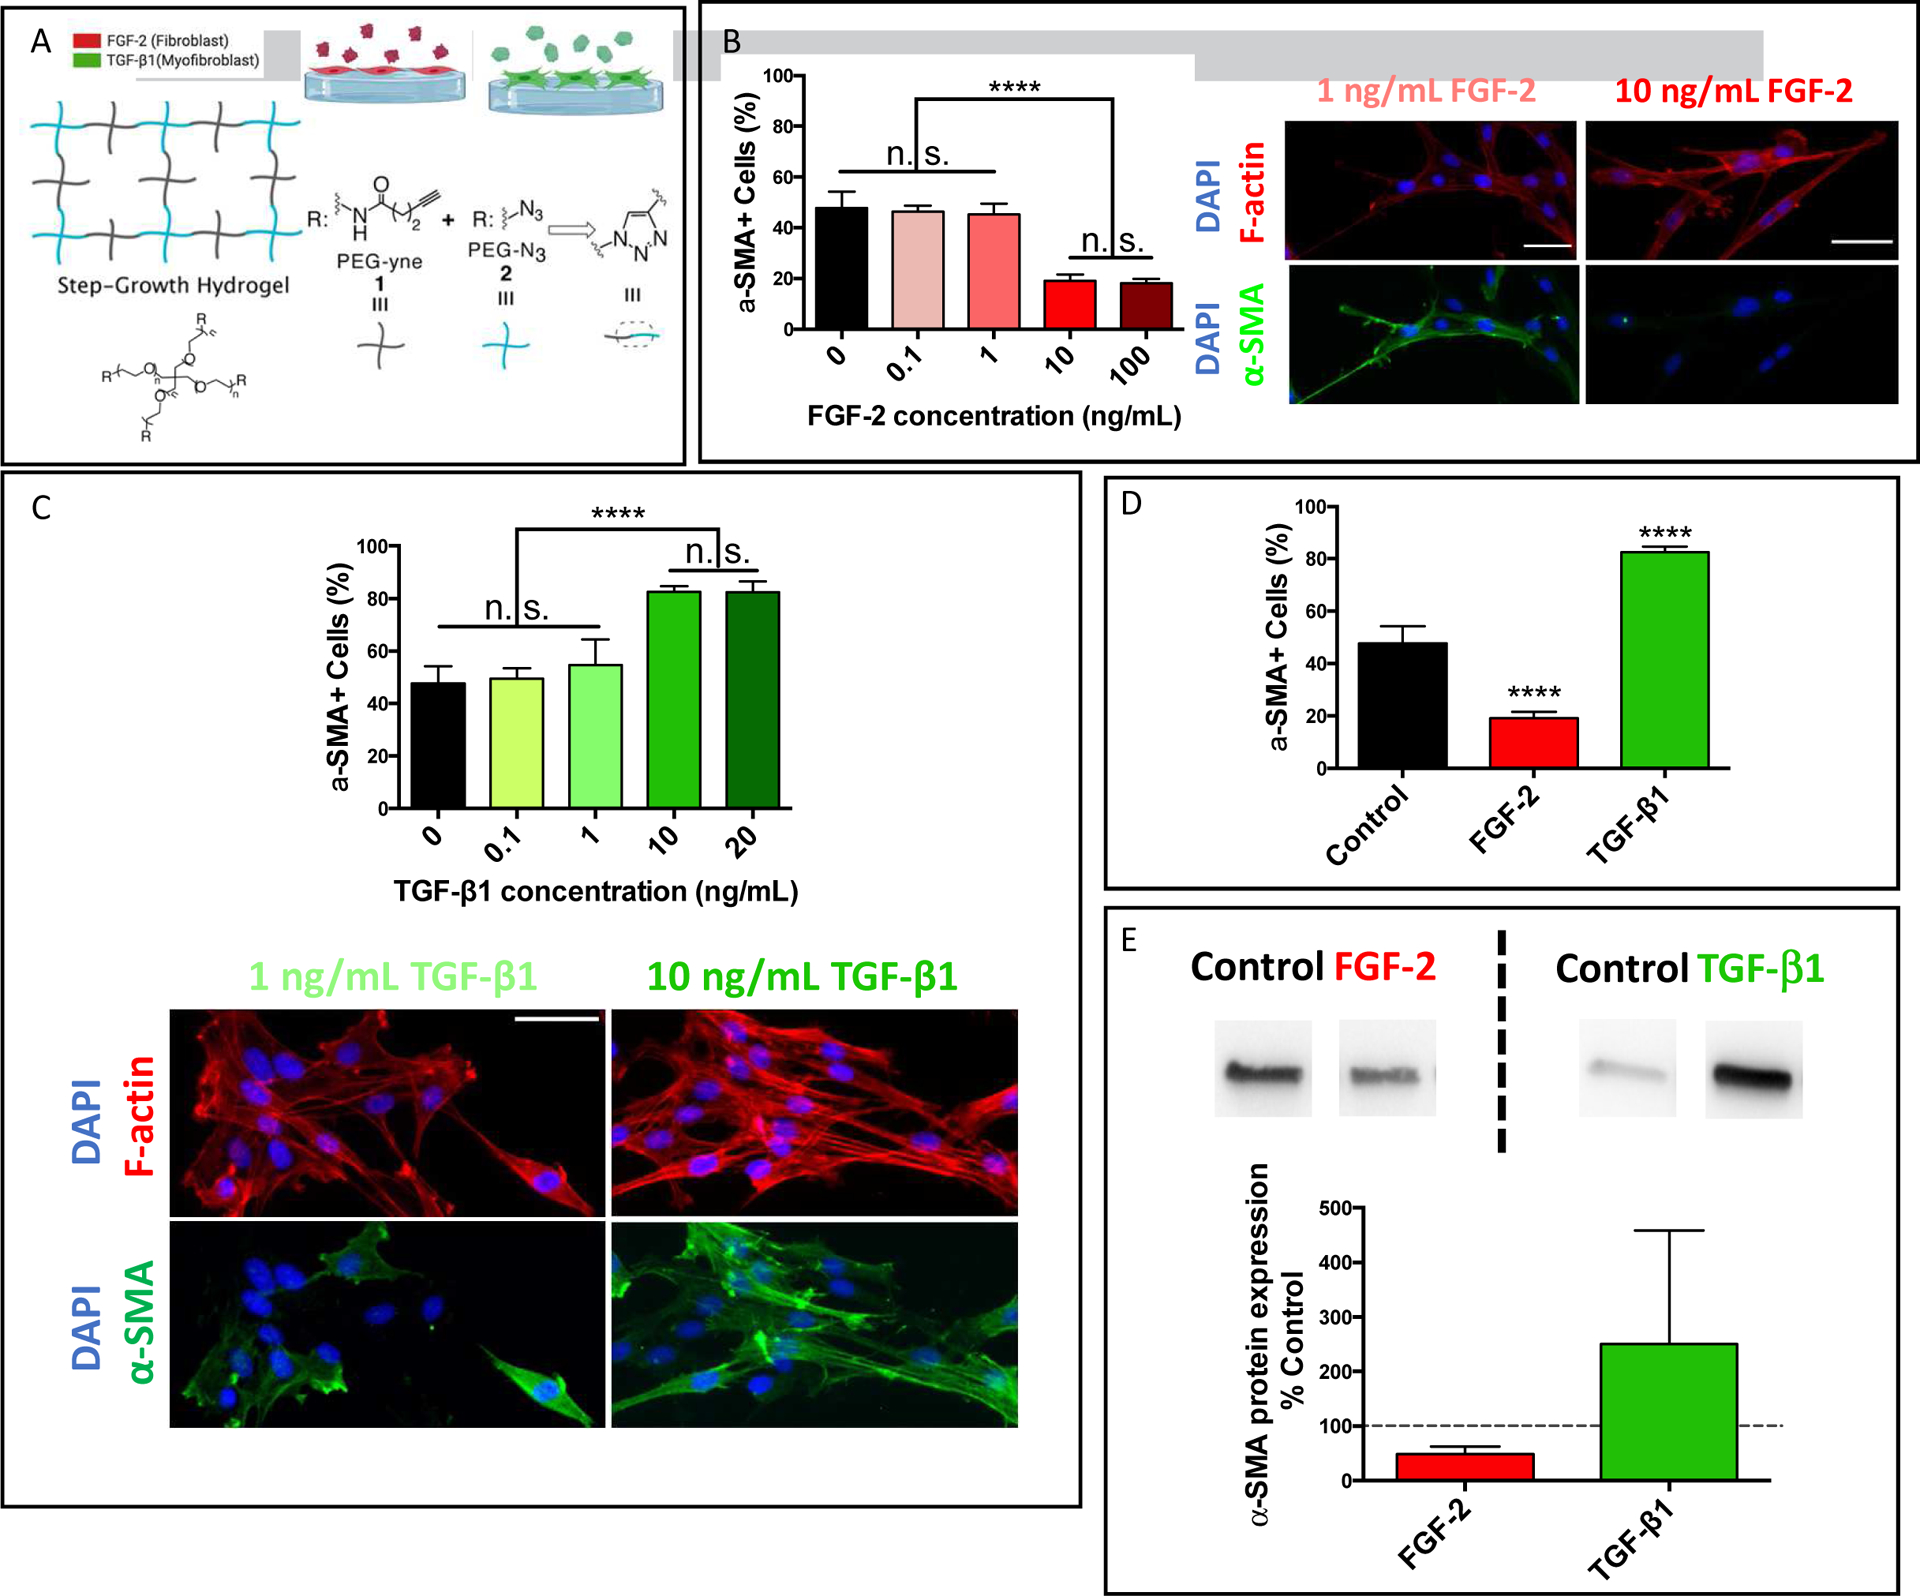
A) Schematic of hydrogel substrates formed by copolymerizing PEG-Azide and PEG-Alkyne macromers via a copper catalyzed click reaction. B) Dose curve of solubly delivered FGF-2 on VIC activation cultured on hydrogel substrates with a Young’s modulus, E = 7.8±0.3 kPa. Representative immunostaining images of αSMA stress fibers (green) and F-actin (red) for VICs treated with either 1 or 10 ng/mL of FGF-2. C) Dose curve of solubly presented TGF-β1 on VIC activation on hydrogel substrates with a Young’s modulus, E = 7.8±0.3 kPa. Representative immunostaining images of αSMA stress fibers (green) and F-actin (red) for VICs treated with either 1 or 10 ng/mL of TGF-β1. D) FGF-2 and TGF-β1 effects, both at 10 ng/mL, on VIC phenotypic changes as assessed by the percentage of αSMA stress fiber positive cells. E) FGF-2 and TGF-β1, both at 10 ng/mL, effects on VIC αSMA protein expression as analyzed via western blot. Values are plotted as mean ± standard deviation. *: p<0.05, ****: p<0.0001, based on one-way ANOVA. n = 3 with duplicates, more than 200 VICs were analyzed per sample. Scale bar = 50 μm.