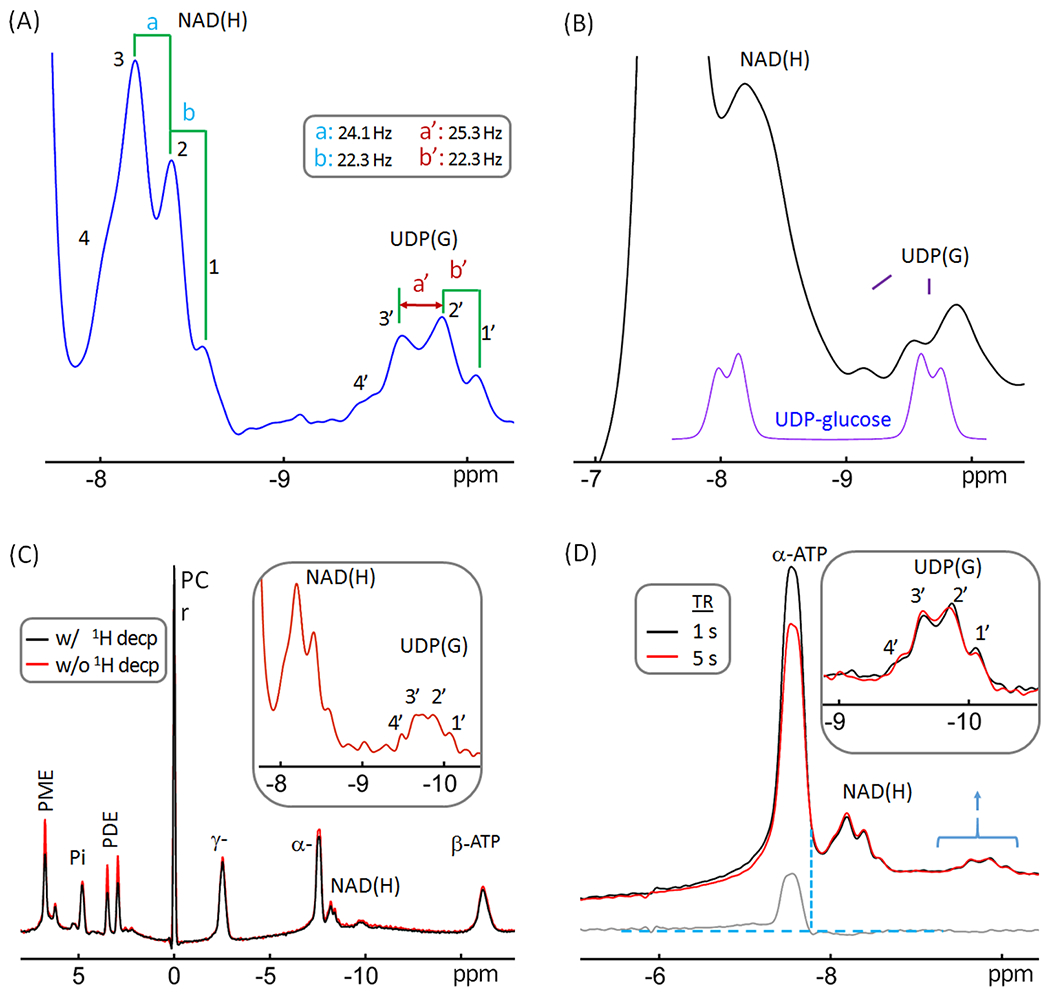
Figure 4.

Reexamination of the resonance pattern observed in the −9.8 ppm resonance previously assigned exclusively to UDP-glucose. (A) A regional brain 31P spectrum showing the splitting features of resonance signals at −8.2 pm and −9.8 ppm. Note that the resonance pattern of the −9.8 ppm signal is not a simple doublet, suggesting the presence of additional UDP(G) species beside UDP-glucose. (B) (Bottom purple trace) UDP-glucose 31P signals at 7T simulated with aqueous solution NMR data (Δδ = 1.6 ppm and 2JPP = 20.5 Hz) acquired at 202.5 MHz. (Top black trace) A brain 31P MR spectrum post-processed with a line-broadening factor of 25 Hz. Note the difference in span, splitting, and relative peak magnitude of the upfield doublet between the simulated and in vivo data. (C) Brain 31P MR spectra acquired at TR 5 s with (red trace) and without (black trace) wideband 1H-decoupling, showing that the large splitting of the upfield signal at −9.8 ppm does not reflect weak 1H-31P coupling. (D) Regional brain 31P spectra acquired at TR = 1 s (black trace) and 5 s (red trace), scaled to the signal at −9.8 ppm to facilitate comparison of resonance patterns. The bottom trace (gray) shows the spectral difference. Note the similarity in linewidth and relative intensity between the NAD(H) signal and the upfield signal at −9.8 ppm. Abbreviations: ATP, adenosine triphosphate; NAD(H), nicotinamide adenine dinucleotide; PCr, phosphocreatine; PDE, phosphodiesters; PME, phosphomonoesters; and PI, inorganic phosphate; UDP(G), a combination of UDP-Gal, UDP-Glc, UDP-GalNAc, and UDP-GlcNAc.
