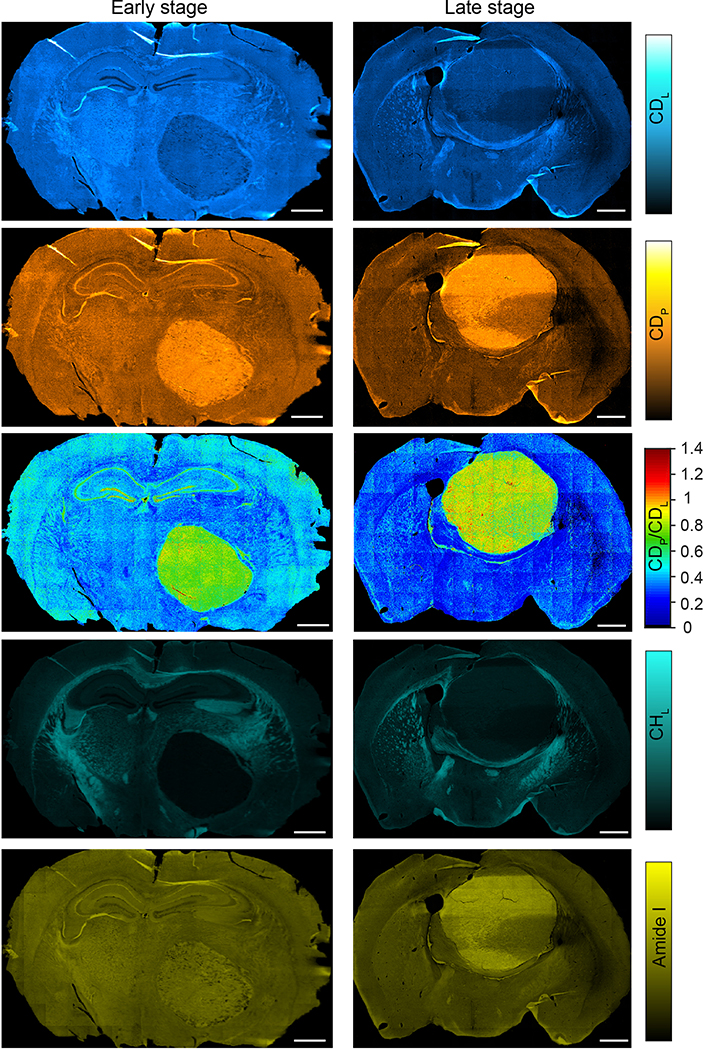
Extended Data Fig. 7 |. MIR metabolic imaging on tumor progression with D2O labeling.
Left column is the early stage and right column is the late stage. Early stage: label from day 0–15 post xenograft; Late stage: label from day 11–26 post xenograft. Experiments were repeated on three tissue slices each with similar results. Scale bars: 1 mm.

