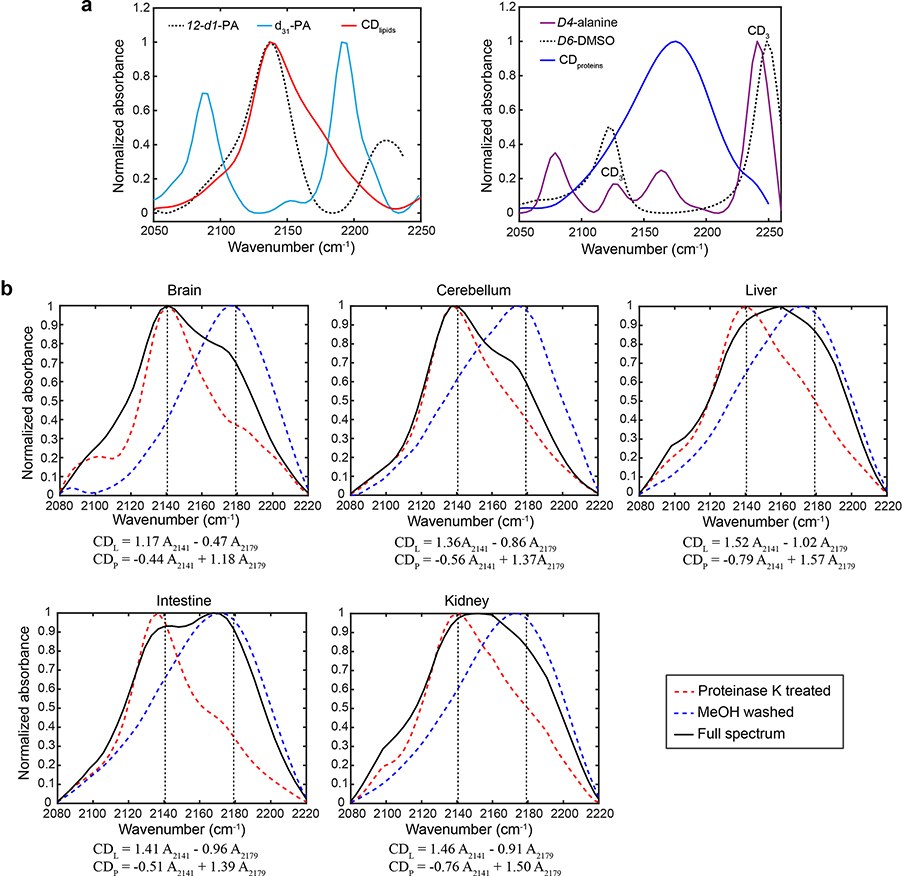
Extended Data Fig. 4 |. Spectral unmixing for D2O labeled tissue from various organs.
a, Spectral characterization on CD vibrations in lipid and protein with solution standards. The isolated D-labeled lipids spectrum agrees with the CD peak in 12-d1-PA (left) and D-labeled protein spectrum matches with the C(α)D peak from d4-alanine (right). Experiments were repeated two times independently with similar results. b, Retrieval of CDP and CDL signals for different organs of D2O labeled mouse. The linear combinational algorithms for different organs are presented below each spectrum. Raw spectra were truncated to spectral region of 2080–2220 cm−1 followed by polynomial baseline correction and normalization. Black solid lines are spectra for untreated tissues, red dashed lines are spectra for lipid components (protein were digested with Proteinase K) and blue dashed lines are spectra for protein components (lipids were removed by methanol wash). Experiments were repeated three times independently with similar results.

