
Figure 1. General rubric relating lactone–zwitterion equilibrium to rhodamine dye performance and optimizing short-wavelength dyes by decreasing KL–Z.
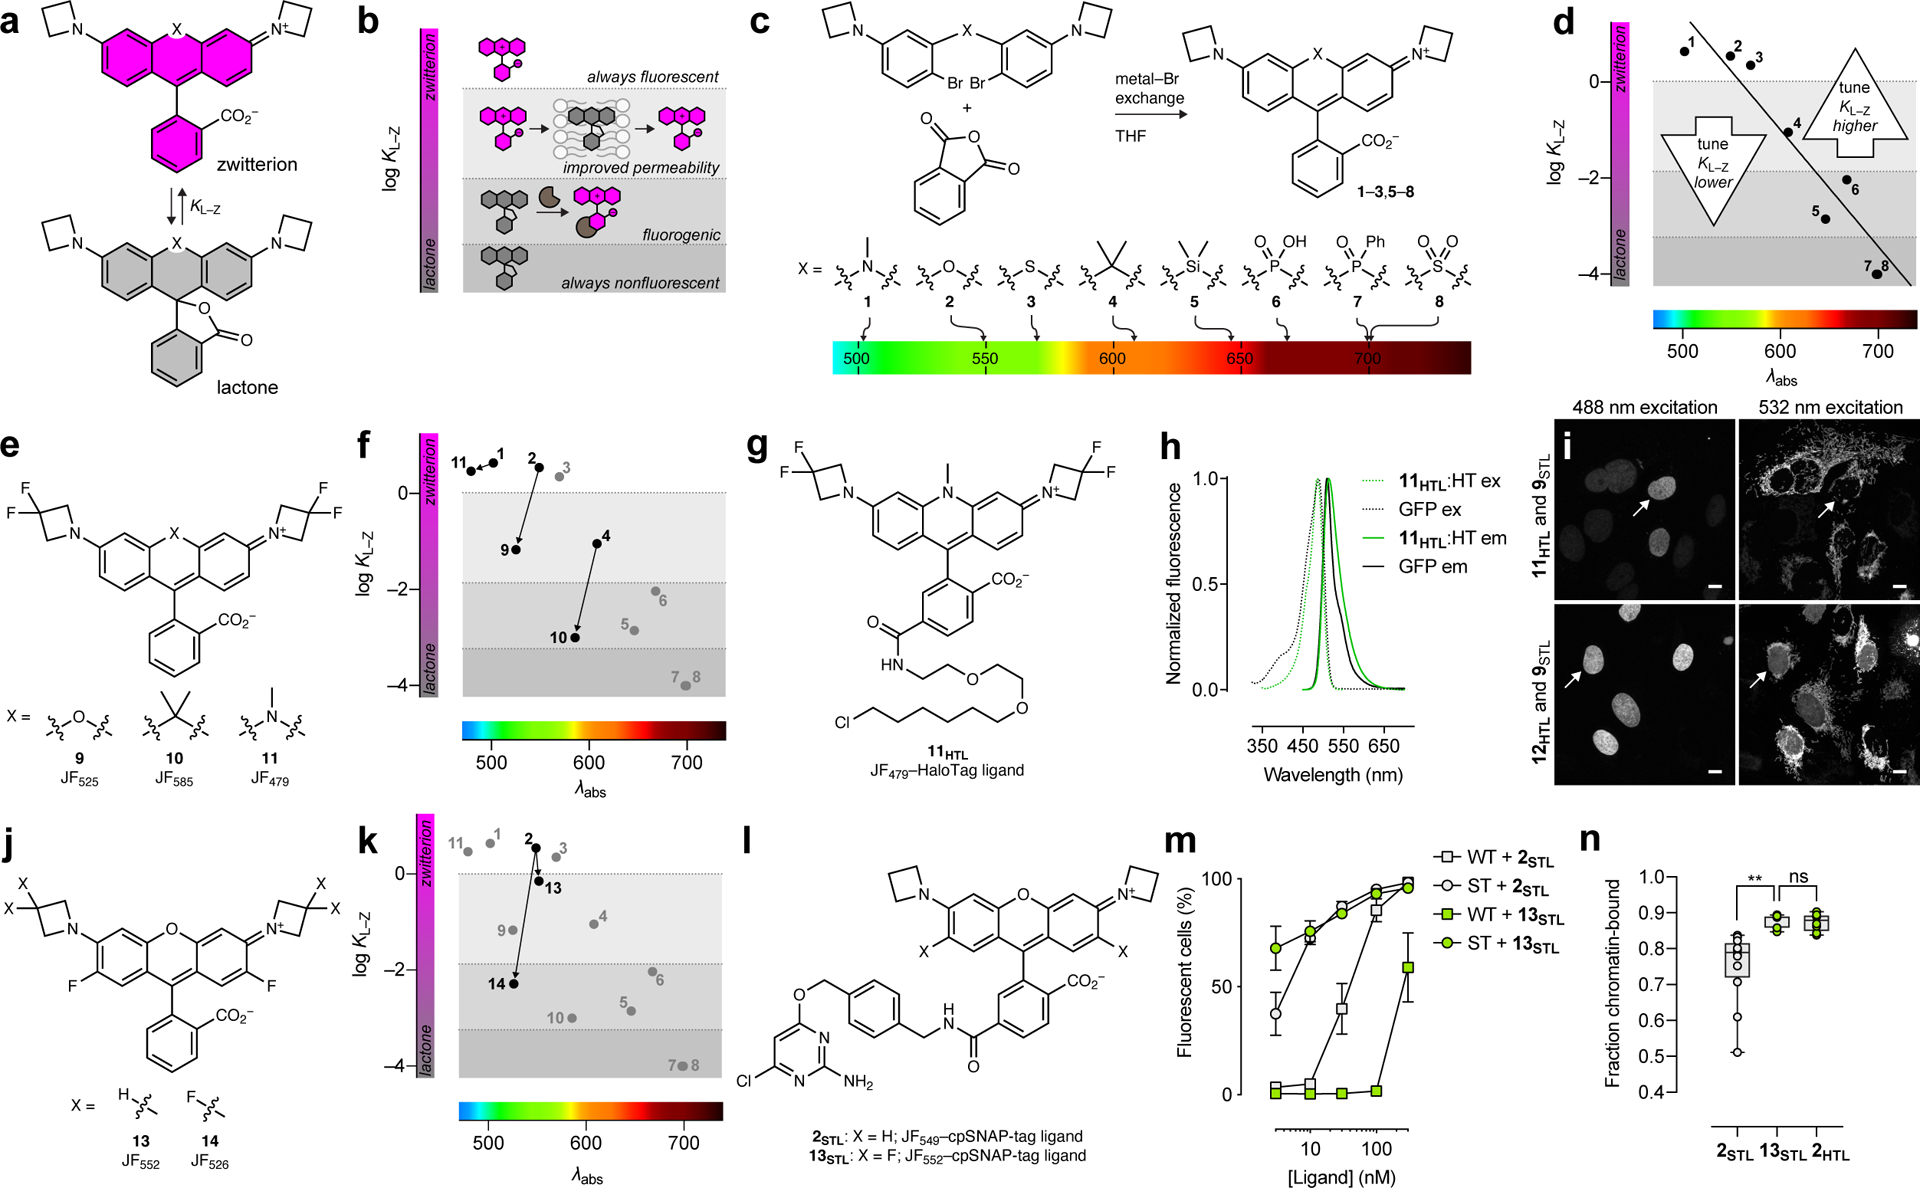
(a) The lactone–zwitterion equilibrium of Janelia Fluor rhodamine dyes and the equilibrium constant KL–Z. (b) Phenomenological plot categorizing the properties of different dyes based on KL–Z. (c) Synthesis, structures, and λabs of dyes 1–8. (d) Plot of KL–Z vs. λabs for dyes 1–8 and general tuning strategies for dyes with short or long λabs. (e) Structures of dyes 9–11. (f) Plot of KL–Z vs. λabs showing decreased KL–Z for dyes 9–11. (g) Structure of JF479–HaloTag ligand (11HTL). (h) Fluorescence excitation (ex) and emission (em) spectra of 11HTL:HaloTag conjugate and GFP. (i) Two-color confocal imaging experiment of live U2OS cells expressing HaloTag–histone H2B labeled with either 11HTL (500 nM, 3.5 h) or JF503–HaloTag ligand (12HTL; 500 nM, 3.5 h) excited with 488 nm (left panels) and TOMM20–SNAP-tag labeled with JF525–cpSNAP-tag ligand (9STL; 100 nM, 30 min, 3× wash) excited with 532 nm (right panels); scale bars: 10 μm; this experiment was duplicated with similar results. White arrows highlight the absence (11HTL) or presence (12HTL) of nuclear signal in the 532 nm-excited channel. (j) Structures of dyes 13–14. (k) Plot of KL–Z vs. λabs showing decreased KL–Z for dyes 13–14. (l) Structures of 2STL and 13STL. (m) Plot of fluorescently labeled mouse embryonic stem (ES) cells (%) vs. time determined by flow cytometry. Wild-type ES cells (WT) or ES cells expressing SNAP-tag–histone H2B (ST) were incubated with 2STL or 13STL (15 min); error bars show SE; experiments using 2STL n = 7 independent cellular samples except for [ligand] = 3 nM where n = 5 independent cellular samples; experiments using 13STL n = 3 independent cellular samples. (n) Plot showing fraction of chromatin-bound molecules per cell in single-particle tracking experiments using 2STL and 13STL in cells expressing SNAP-tag–histone H2B and 2HTL in U2OS cells expressing HaloTag–histone H2B; center line indicates median; box limits indicate upper and lower quartiles; whiskers indicate min–max; one-way ANOVA gave adjusted P Value = 0.0013 (**) for 2STL vs. 13STL and adjusted P Value = 0.9963 (ns) for 13STL vs. 2HTL; n = 12 cells for experiments using 2STL and n = 8 cells for experiments using 13STL and 2HTL.