
Extended Data Fig. 7. Further fine-tuning of JF571 (19) and JF722 (17).
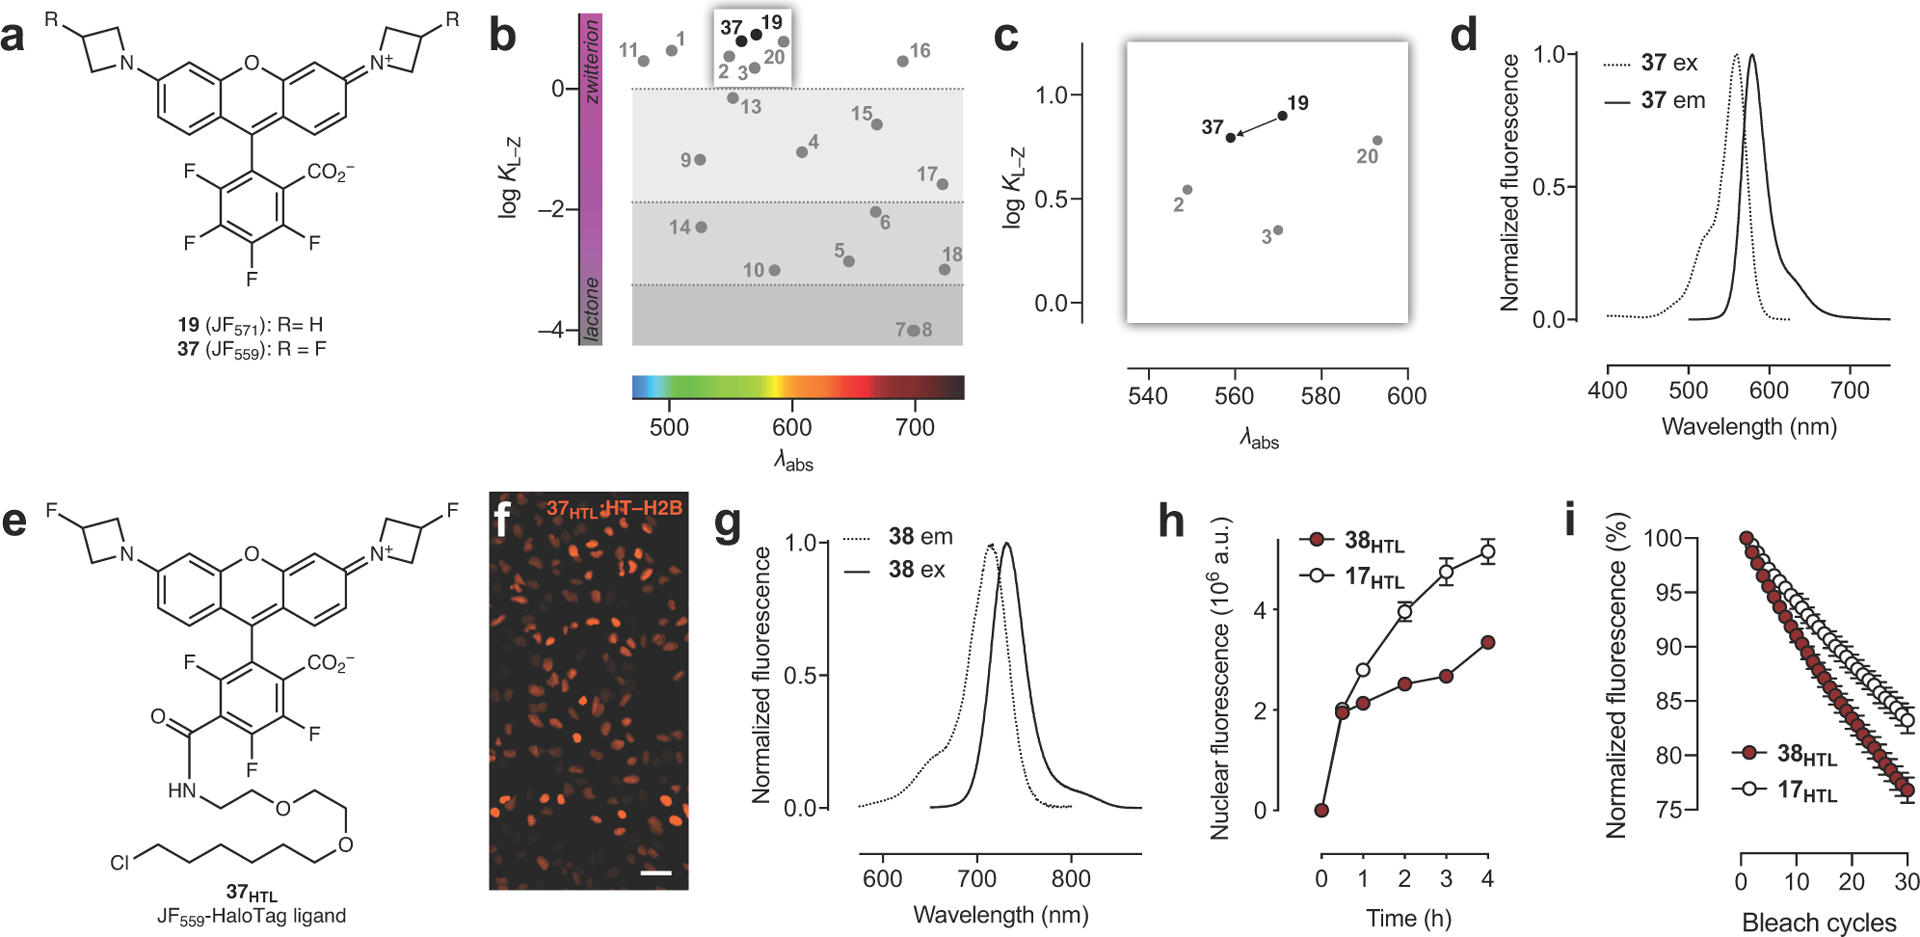
(a) Structure of JF571 (19) and JF559 (37). (b–c) Full plot of KL–Z vs. λabs (b) and zoom-in (c) showing decreased KL–Z for dye 37. (d) Fluorescence excitation (ex) and emission (em) spectra of JF559 (37). (e) Structure of JF559–HaloTag ligand (37HTL). (f) Widefield imaging experiment of U2OS cells expressing HaloTag–histone H2B labeled with 37HTL (100 nM, 30 min, 3× wash); scale bar: 51 μm; experiment was duplicated with similar results. (g) Fluorescence excitation (ex) and emission (em) spectra of JF711 (38). (h) Nuclear fluorescence vs. time upon addition of ligands 17HTL (200 nM) or 38HTL (200 nM) to live cells expressing HaloTag–histone H2B; error bars indicate SE; n = 100 nuclei except for: t = 0.5 h with 38HTL where n = 86 nuclei; t = 1 h with 38HTL where n = 94 nuclei; t = 2 h with 38HTL where n = 96 nuclei; t = 0.5 h with 17HTL where n = 94 nuclei. (i) Plot of fluorescence from cells expressing HaloTag–H2B labeled with 17HTL (200 nM) or 38HTL (200 nM) over 30 bleach cycles; error bars indicate SE; ; n = 3 independent cellular samples.