
Extended Data Fig. 3. Utility of JF552–cpSNAP-tag ligand (13STL) in cellular imaging experiments.
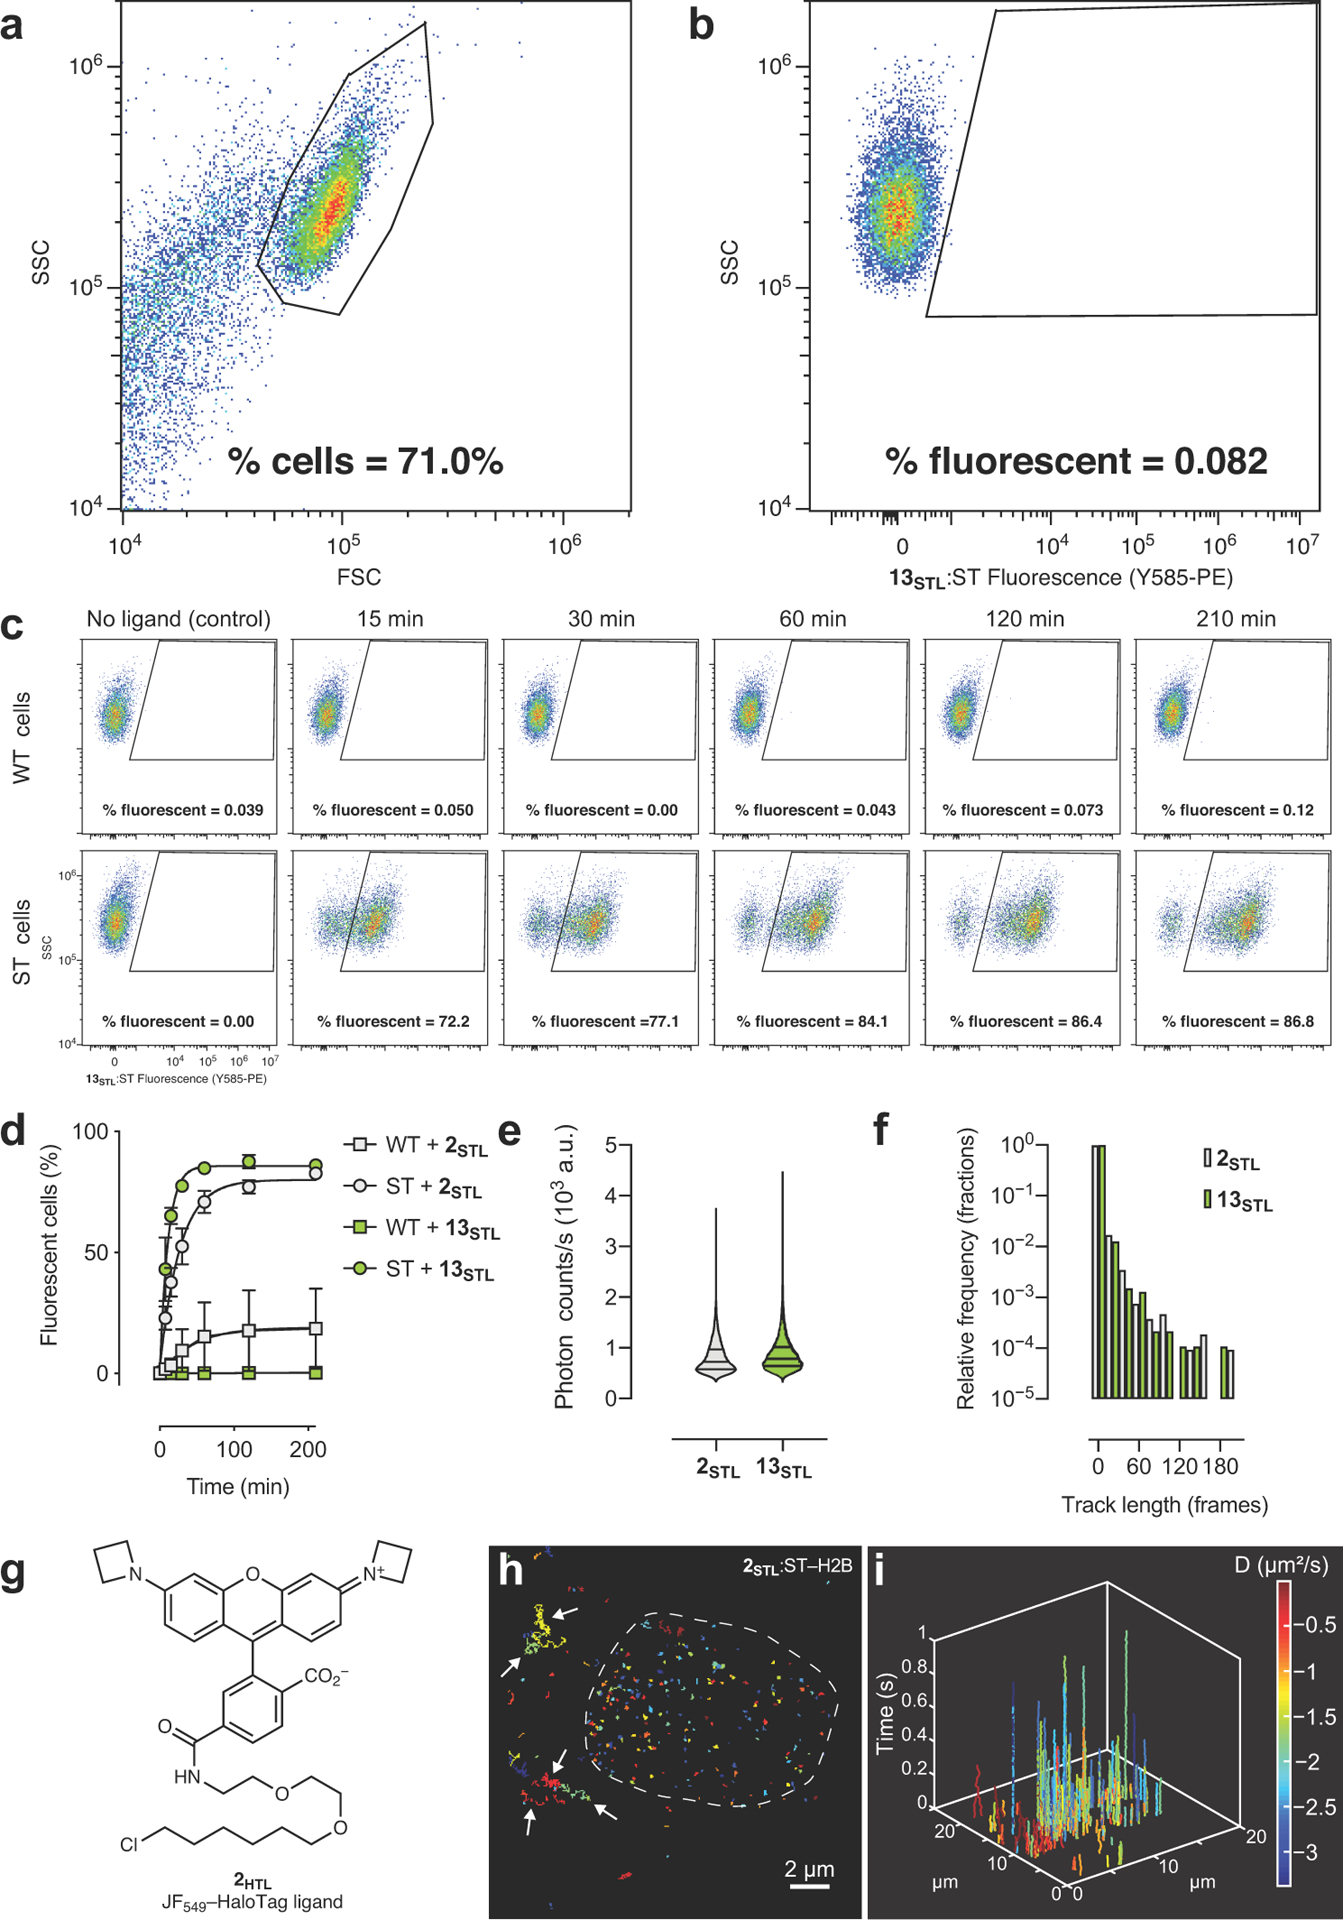
(a) Representative flow cytometry plot showing forward light scatter (FSC) vs. side light scatter (SSC) demonstrating gating strategy to separate cells from debris; experiment was duplicated with similar results. (b) Representative flow cytometry plot showing SSC vs. fluorescence of 13STL:SNAP-tag measured using the Y585-PE channel (561 nm laser excitation, 585 nm with a 42 nm bandpass emission) to demonstrate gating strategy to separate fluorescent and nonfluorescent cells; experiment was duplicated with similar results. (c) Representative flow cytometry plots showing the change in % fluorescent cells as a function of incubation time with 13STL (10 nM); top row: wild-type (WT) embryonic stem (ES) cells; bottom row SNAP-tag–histone H2B (ST) expressing ES cells; experiment was duplicated with similar results. (d) Plot of fluorescent mouse ES cells (%) vs. time determined by the flow cytometry experiment exemplified in c. WT cells or ST cells were incubated with 2STL or 13STL (10 nM) for different times and % fluorescent cells were measured; error bars show SE; experiments using 2STL n = 3; experiments using 13STL n = 4 except for t = 7.5 min where n = 2 and t = 210 min where n = 3. (e) Violin plot of photon counts from a single-particle tracking (SPT) experiment using U2OS cells expressing SNAP-tag–histone H2B and labeled with 2STL or 13STL (2 nM, 30 min, 3× wash); lines indicate median and quartiles; n = 19008 single-molecule events for experiment using 2STL and n = 9511 single-molecule events for experiment using 13STL. (f) Histogram of track lengths from SPT experiment using cells expressing SNAP-tag–histone H2B and labeled with 2STL or 13STL (2 nM, 30 min, 3× wash); n = 10822 single-molecule events for experiment using 2STL and n = 9387 single-molecule events for experiment using 13STL. (g) Structure of JF549–HaloTag ligand (2HTL). (h) Image of individual SPT traces in live U2OS cells expressing SNAP-tag–histone H2B and labeled with 2STL (2 nM, 30 min, 3× wash); dashed line indicates outline of nucleus; arrows highlight nonspecific staining in cytosol; scale bar: 2 μm. (i) 3D kymograph showing data from e detailing single-particle track position and length as a function of time. Diffusion coefficient values (D) are calculated from single-particle tracking data and color-coded; experiment was duplicated with similar results.