
Figure 2.
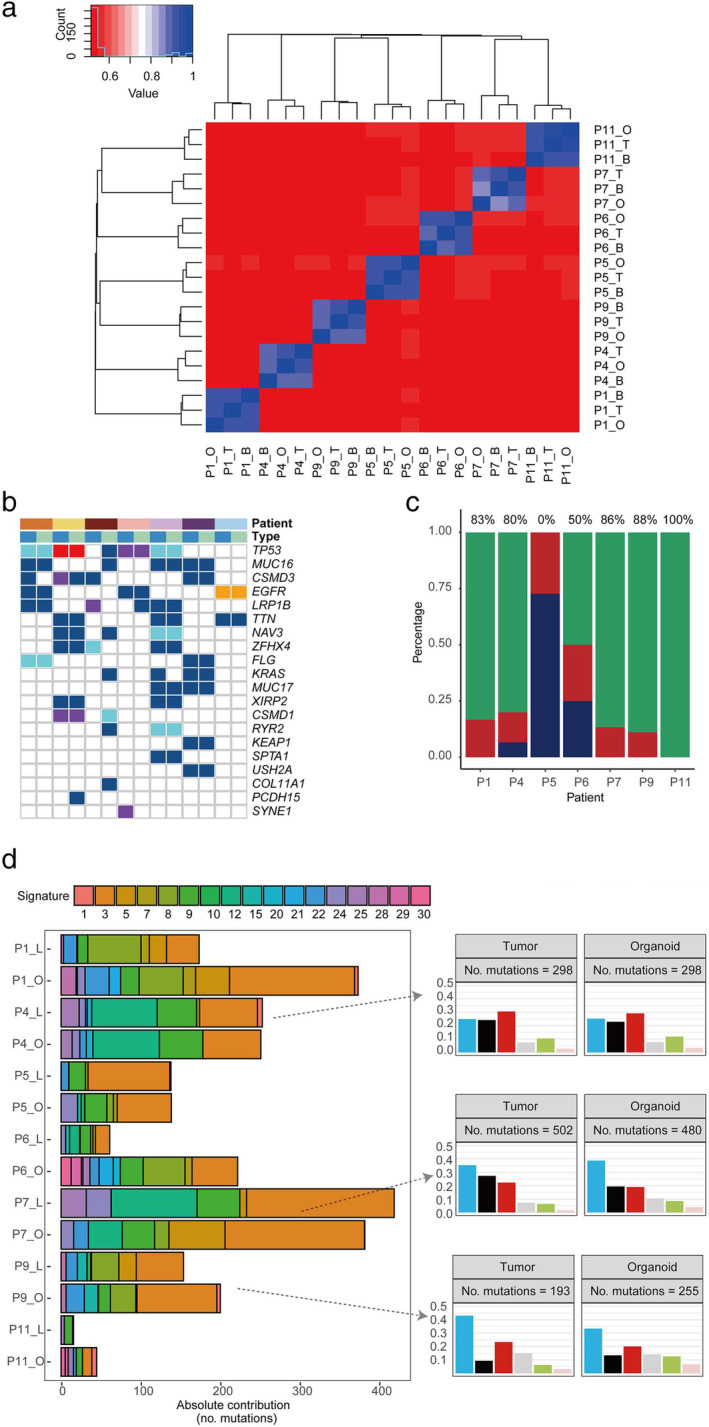
Genotypic features of the paired samples. (a) Heat map of the germline mutations in the peripheral blood, organoids, and tumor tissues of each patient. (b) Mutations detected in paired tissues (tumor and organoid) on the basis of gene mutations in lung cancer (top 20 genes are shown) Patient ( ) P1, (
 ) P4, (
 ) P5, (
 ) P6, (
 ) P7, (
 ) P9, and (
 ) P11; Mutation (
 ) Missense, (
 ) Nonsense, (
 ) Frame Shift, (
 ) Splicing, (
 ) In Frame Indel; Type (
 ) Tumor, and (
 ) Organoid. (c) Concordance of somatic mutations detected in the organoid and corresponding tumor tissue (
 ) Concordant, (
 ) Organoid only, and (
 ) Tumor only. (d) Mutation signature distributions of organoid lines and tumor tissues in each patient. Signature types are displayed in the right panel. C > A, C > G, and C > T were the most common point mutations in our paired samples Point mutation type (
 ) C>A, (
 ) C>G, (
 ) C>T, (
 ) T>A, (
 ) T>C, and (
 ) T>G.