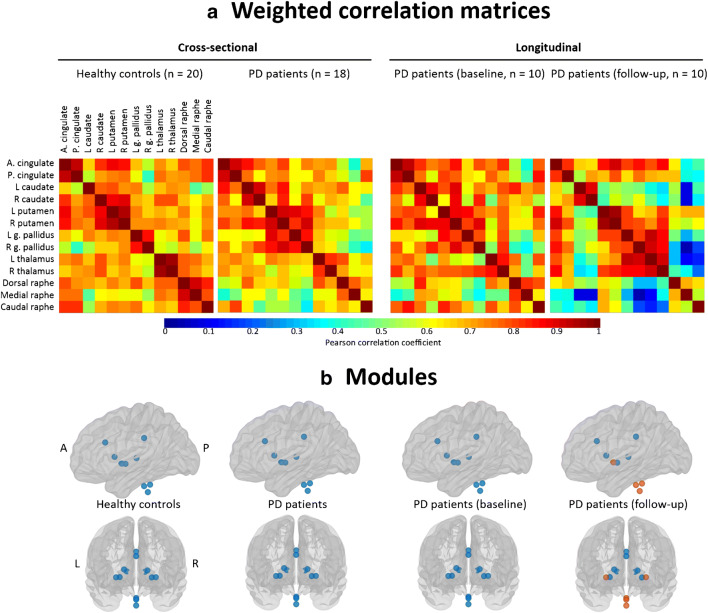
Fig. 1.
a, b The upper panel (a) shows weighted correlation matrices based on SERT binding potential values (BPND) of PD patients and HC at baseline, as well as for the 10 PD patients with longitudinal data (the same 10 PD patients both at baseline and follow-up assessments for longitudinal analysis). The lower panel (b) shows brain modules at baseline and at follow-up. Brain modules I in blue, module II in orange. A anterior, P posterior, L left, R right, PD Parkinson’s disease, g. pallidus globus pallidus

