Fig. 3.

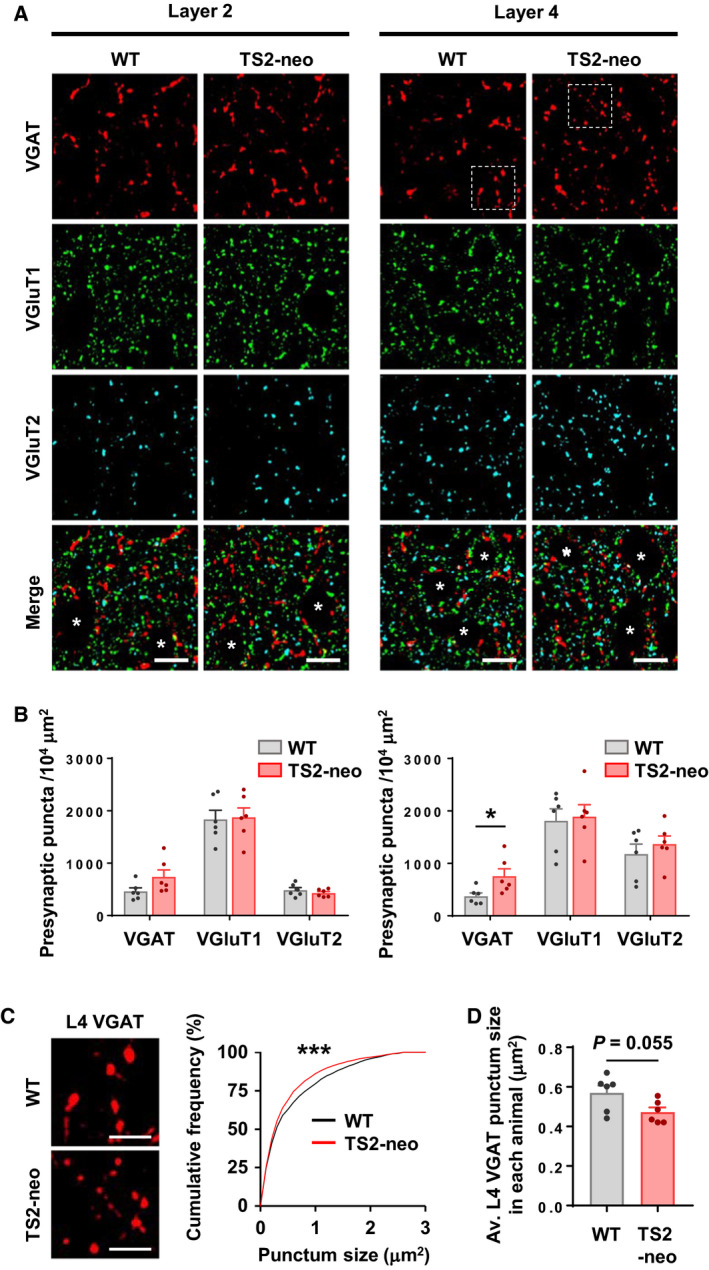
Excess inhibitory synapses in TS2‐neo mice during neural circuit development. (A) Deconvoluted images of presynaptic markers in the primary somatosensory cortex at P21. Asterisks indicate cell bodies. (B) VGAT puncta density was increased at L4 of TS2‐neo mice (right), but not at L2 (left). (C) Enlarged images of VGAT puncta corresponding to the dotted squares in A (left). Size of L4 VGAT puncta was decreased in TS2‐neo mice (right). (D) Average size of L4 VGAT puncta in each animal. n = 6 mice per group. Data are mean ± SEM, *P < 0.05, ***P < 0.001; unpaired two‐tailed t‐test with Welch's correction (B, D) and Kolmogorov–Smirnov test (C). Scale bars, 10 μm (A), 5 μm (C).
