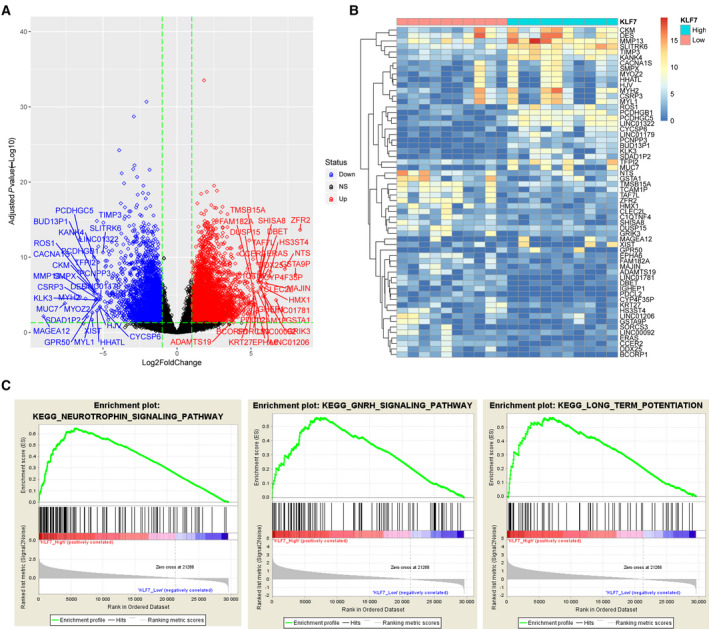
Fig. 4.

GSEA identified potential pathways that are activated or repressed by KLF7 in squamous carcinoma. (A) Volcano plot shows differential expression landscape in KLF7_high samples (n = 251) compared with KLF7_low squamous carcinoma samples (n = 250) from TCGA. Genes with |log2FC| > 5 and P adj < 0.05 were specified by their symbols. (B) Heatmap illustrates expression values of genes with |log2FC| > 5 and P adj < 0.05 in KLF7_high and KLF7_low squamous carcinoma samples. (C) Details of the top three most significantly enriched KEGG pathways in KLF7_high squamous carcinoma samples. NS, not significant.
