
Figure 2.
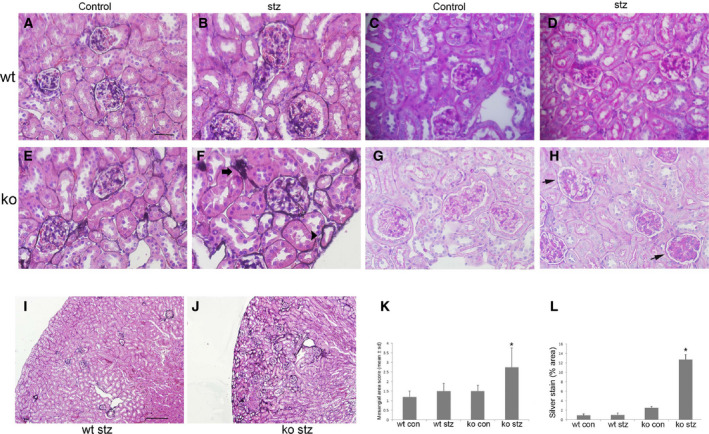
Mesangial cell proliferation and mesangial and peritubular matrix deposition are increased in stz‐treated Id1 KO mice. Methenamine silver stains of kidneys from control (scale bar = 30 μm A–H) and stz‐treated WT (B) and control (E) and stz‐treated (F) Id1 KO mice (arrow: glomerular arteriole, arrowhead: tubular basement membrane, and open arrow: glomerular basement membrane silver staining). PAS stain of kidneys from control (C) and stz‐treated WT (D) and control (G) and stz‐treated Id1 KO (H) mice (arrows: PAS‐positive mesangial matrix accumulation). Original magnification = 400×. (K) Quantification of mesangial cell area (% area 0–25: 1, 25–50%: 2, 50–75%: 3, > 75%, *P < 0.01) and percent area of silver staining (L) score (n = 5 mice/group, *P < 0.01, one‐way ANOVA) using imagej software with corresponding low‐power (scale bar = 250 μm I, J) silver‐stained images (I, J). Data presented as mean ± SD.