
Figure 8.
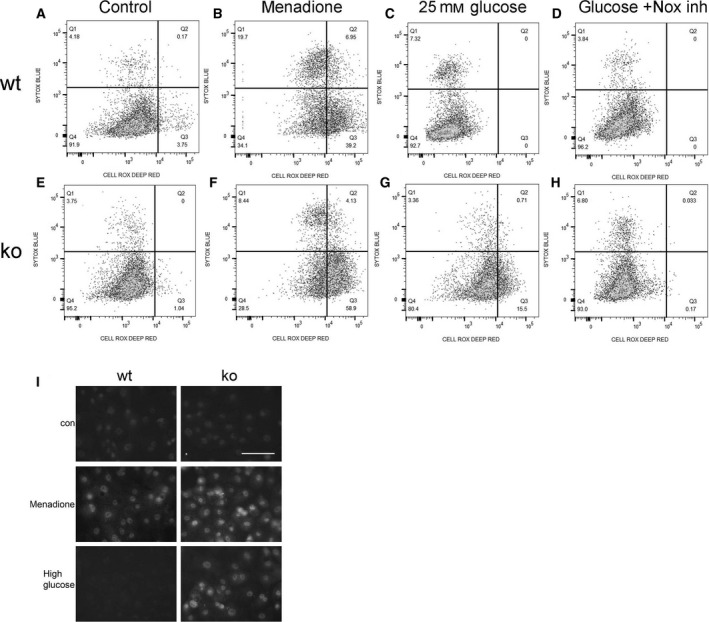
Increased ROS in Id1 KO EC in response to acute hyperglycemia and inhibition with a Nox inhibitor. WT (A‐D) and Id1 KO (E‐H) lung EC treated with 4.5 mm glucose and 20.5 mm mannitol (control), the oxidant menadione (50 μm) as a positive control, 25 mm glucose, or 25 mm glucose + 10 μm Nox inhibitor VAS2870 (Nox inh) 2 h prior to assay with CellROX deep red (x‐axis) and SYTOX Blue dead‐cell indicator (y‐axis) with percent positive cells shown in each quadrant. (I) Immunofluorescence images for 8‐OHdG expression in WT and KO EC treated as indicated, scale bar = 20 μm all images.