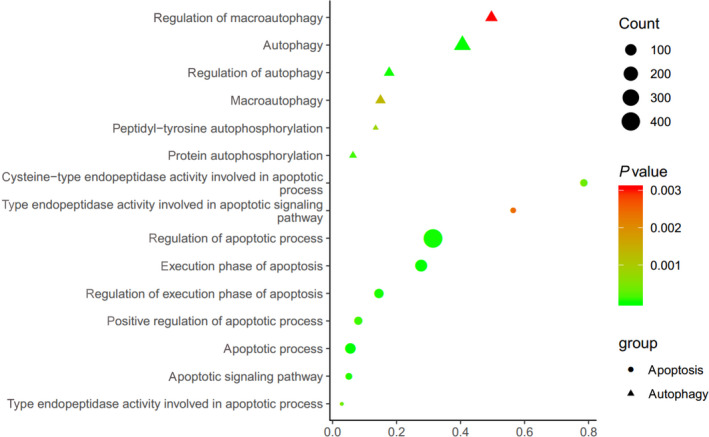
Fig. 3.

GO analysis. Ranking of top 15 biological processes based on GO analysis of differentially expressed lncRNAs. The bar plot shows the top enrichment score of the significant pathway. The intensity of the color indicates the level of difference; darker shades represent greater difference. The circle represents the relationship; larger circles represent a stronger relationship between the gene and the pathway.
