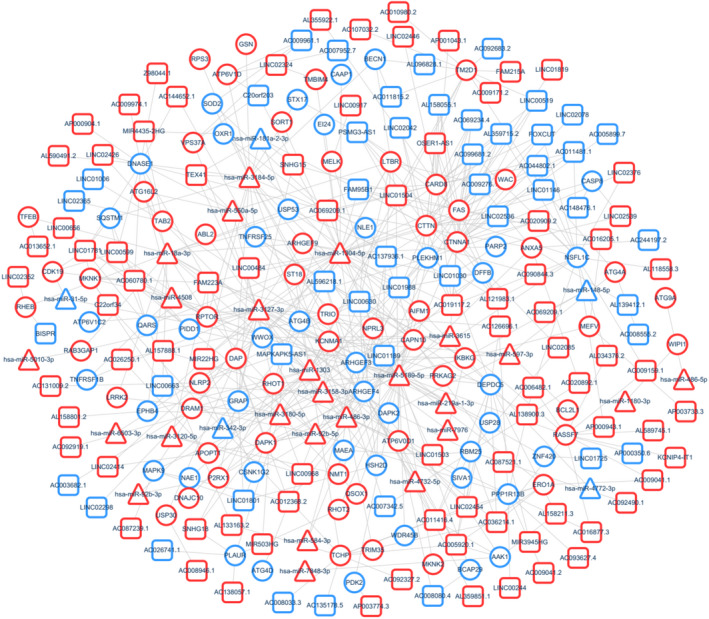
Fig. 6.

lncRNA–miRNA–mRNA coexpression network. Squares, triangles and circles represent lncRNAs, miRNAs and mRNAs, respectively. Red represents up‐regulation, and blue represents down‐regulation. Node size represents the degree.

lncRNA–miRNA–mRNA coexpression network. Squares, triangles and circles represent lncRNAs, miRNAs and mRNAs, respectively. Red represents up‐regulation, and blue represents down‐regulation. Node size represents the degree.