Fig. 2.

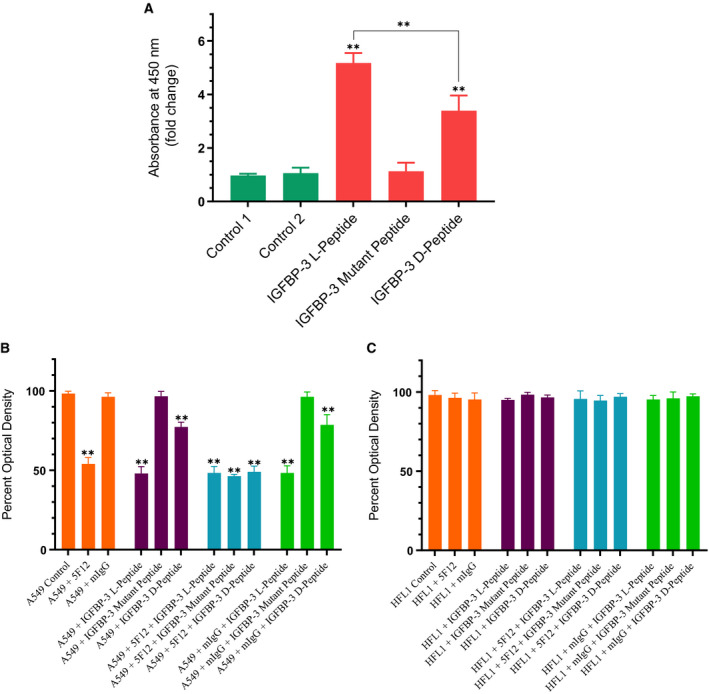
WT IGFBP‐3 l‐peptide is more effective than the d‐peptide in both binding HA and in blocking viability of A549 cells that express CD44 as compared to the CD44‐negative cell line, HFL1. (A) IGFBP‐3 peptides (50 nm each) were bound to the ELISA plate wells, and then, 200 nm biotin‐HA was added and processed as described in the Materials and methods section. The data were normalized to the control incubated with BSA (control 1), and fold change relative to the control was calculated. Control 2 is a negative control that included bound WT IGFBP‐3 l‐peptide and added streptavidin–HRP and TMB without addition of biotin‐HA. Each column represents the mean ± SD of three independent experiments, each run in triplicate. The asterisks (**P < 0.01) indicate a statistically significant difference from control 1 and of the IGFBP‐3 l‐peptide compared to the d‐counterpart. The absence of asterisks indicates no significance, Mann–Whitney test. (B, C) IGFBP‐3 peptides were added to cells in the absence or presence of the mIgG (5 μg·mL−1) antibody control or the CD44, 5F12 antibody (5 μg·mL−1), known to block HA‐CD44 interactions. Cell viability was assessed by the MTT assay. Cells were seeded in 96‐well plates at 0.2 × 10⁵ cells per well in 10% FBS‐supplemented media. The following day, the cell monolayers were incubated in serum‐free medium for 12 h and then treated as indicated for 48 h with the media containing the specific components in the different treatments replaced every 12 h. The concentration of IGFBP‐3 peptides added was 50 nm. The mIgG and CD44 antibodies were added either separately or 2 h prior to addition of IGFBP‐3 peptides. Optical density measurements (570 nm) were normalized by expressing each point in relation to the untreated control of each cell line (set to 100%). Each column represents the mean ± SD of three independent experiments, each run in triplicate. Asterisks (*) indicate a statistically significant difference from the corresponding untreated cell line control, *P < 0.05, **P < 0.01 of each cell line. The absence of asterisks indicates no significance, Mann–Whitney test.
