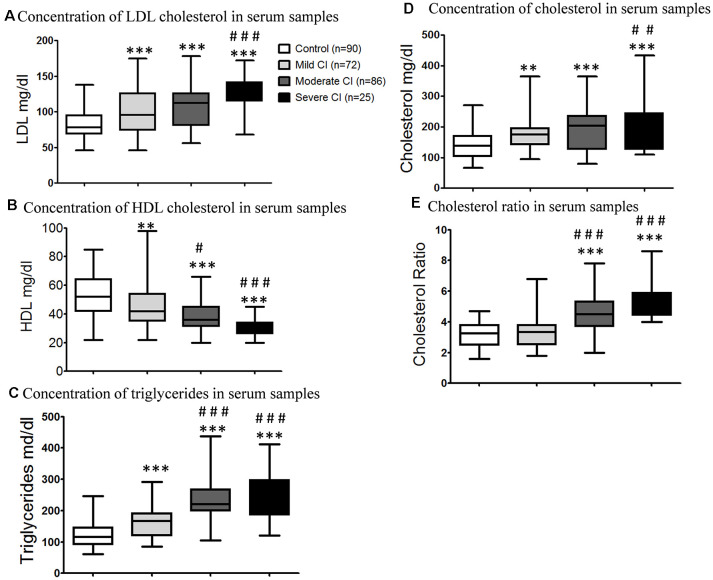
Figure 2.
Bar graph showing the total and fractional cholesterol in serum samples of age-matched healthy control, mild CI, moderate CI and severe cognitively impaired subjects. (A) Low-density lipoprotein (LDL) cholesterol in serum samples. (B) High-density lipoprotein (HDL) cholesterol level in serum samples. (C) Triglycerides level in serum samples. (D) Total cholesterol concentration in serum samples. (E) Cholesterol ratio in serum samples. **p < 0.01, ***p < 0.001 compared with age-matched healthy control group; #p < 0.05, ##p < 0.01, ###p < 0.001 comparison with mild cognitive impaired group; n, samples size.

