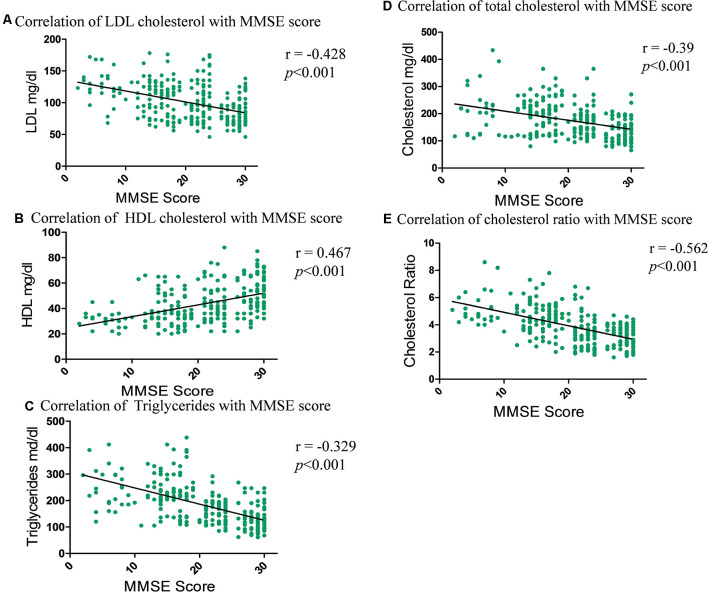
Figure 3.
Correlation graph showing the relationship between the total and fractional cholesterol in serum samples and subjects MMSE score. (A) Correlation of LDL cholesterol with MMSE scores. (B) Correlation of HDL cholesterol with MMSE scores. (C) Correlation of triglycerides with MMSE scores. (D) Correlation of total cholesterol with MMSE scores. (E) Correlation of cholesterol ratio with MMSE scores.

