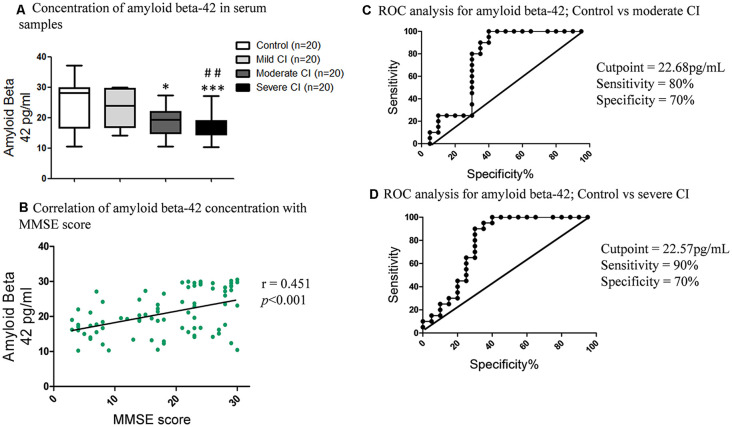
Figure 6.
Serum amyloid beta-42 levels and its correlation with MMSE, and ROC curves. (A) Concentration of serum amyloid beta-42 in serum samples in studied subjects. *p < 0.05, ***p < 0.001 compared with age-matched healthy control group; ##p < 0.01 comparison with mild cognitive impaired group; n = sample size. (B) Correlation of serum amyloid beta-42 concentration with MMSE scores. ROC curves of (C) Control vs. moderate CI and (D) Control vs. severe CI.

