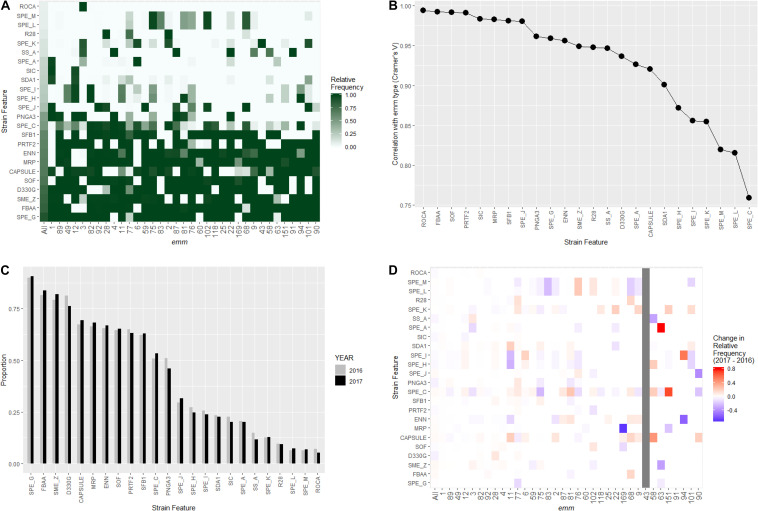
FIGURE 3.
Distribution of virulence related strain features in invasive S. pyogenes isolates identified through the Active Bacterial Core surveillance in 2016 and 2017. (A) Relative frequency of strain feature by emm type. The color scale indicates the proportion of isolates that were positive for indicated strain feature within an emm type. “All” represents all emm types combined. (B) Correlation between emm type and each strain feature. The x-axis is ordered by decreasing association strength (Cramer’s V). (C) Prevalence of strain features for isolates identified in 2016 (gray bars) and 2017 (black bars). (D) Change of strain feature relative frequency within individual emm type. The color scale of each tile represents the difference in within-emm relative frequency of a strain feature between 2016 and 2017. Red indicates an increase while blue indicates a decrease. The within-emm relative frequency could not be calculated for emm43 in 2016 because no emm43 isolate was observed in that year.

