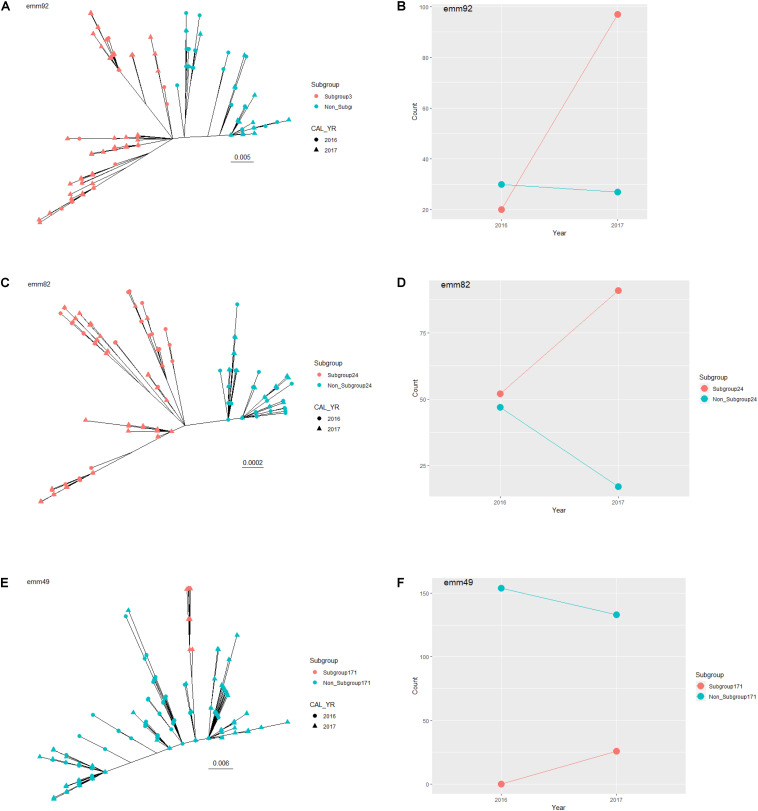
FIGURE 4.
Expanding subgroups within emm type between 2016 and 2017. Unrooted maximum-likelihood trees are shown for all emm92 isolates (A), all emm82 isolates (C), and all emm49 isolates (E), identified through the Active Bacterial Core surveillance in 2016 and 2017. The expanding subgroup isolates are colored in red. The scale bar indicates expected change per site. Counts of expanding subgroup isolates (red) and non-expanding subgroup isolates (blue) in 2016 and 2017 are shown for emm92 (B), emm82 (D), and emm92 (F).

