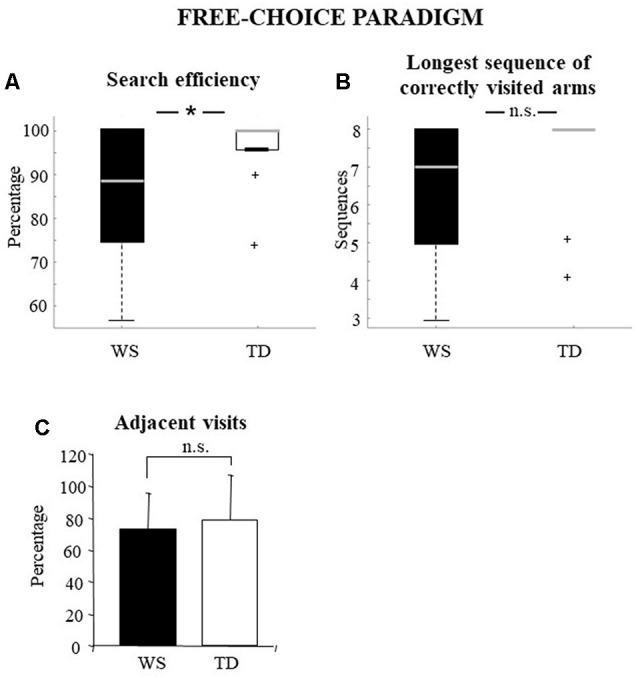
Figure 2.

Performances of the Williams syndrome (WS) participants and TD children in free-choice paradigm. Data are expressed as median and quartiles (A,B) and mean ± SD (C). The asterisk indicates the significance level of Mann–Whitney U (*p < 0.05), +indicates outliers. ns = no significant difference.
