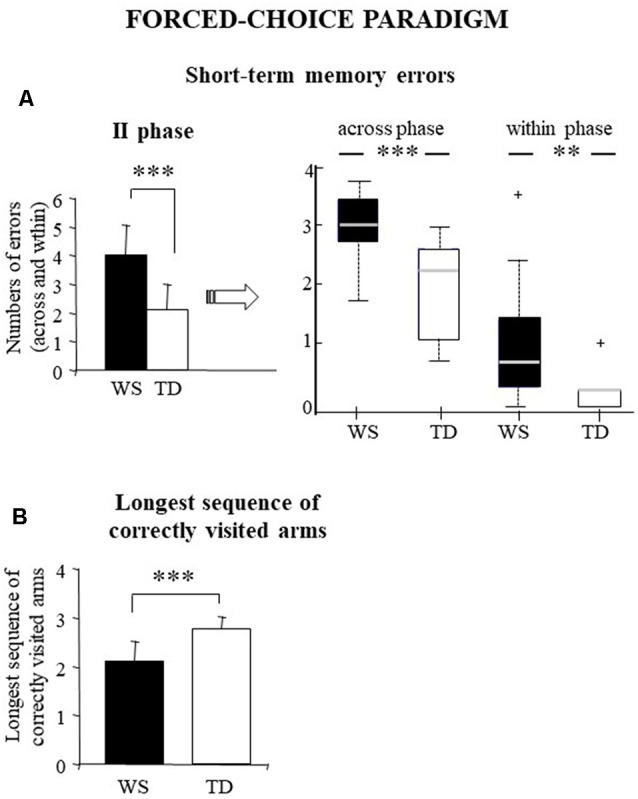
Figure 3.

Performances of the WS and TD participants in forced-choice paradigm. Data are expressed as mean ± SD: (left side of part A and B) and median and quartiles (right side of part A). The asterisks indicate the significance level of ANOVAs and Wilcoxon’s test (**p < 0.005, ***p < 0.00005). +indicates outliers.
