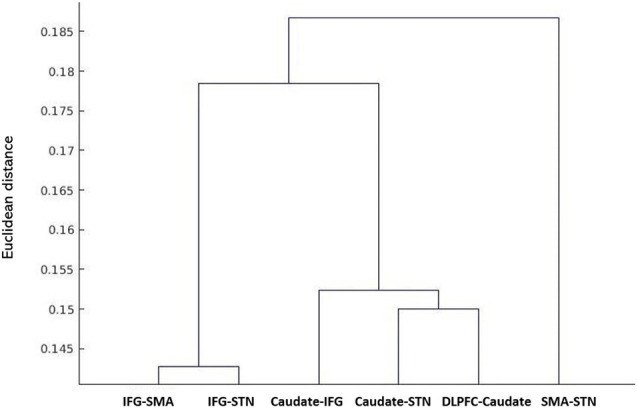
Figure 3.

Hierarchical clustering of fractional anisotropy (FA) displayed as a dendrogram. The Y-axis denotes the Euclidean distance between the pairs of white matter tracts. SMA, supplementary motor area; STN, subthalamic nucleus; IFG, inferior frontal gyrus; DLPFC, dorsolateral prefrontal cortex.
