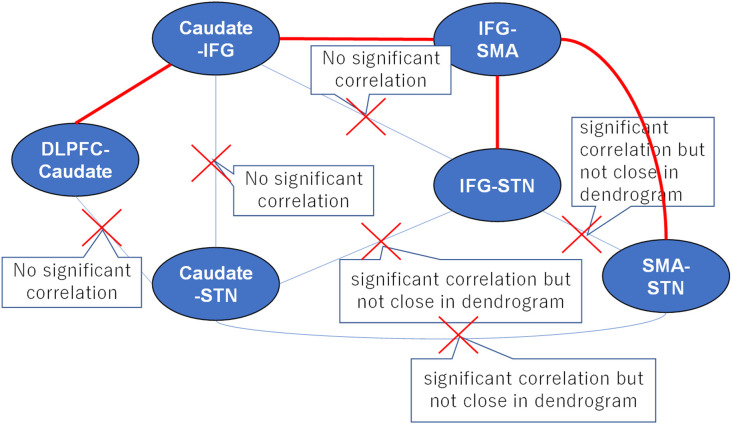
Figure 5.
A proposed strategy of behavioral inhibition. The connections between tracts represent all possible anatomical pathways, and the red crosses denote pathways that were excluded because they could not simultaneously satisfy the requirements of hierarchical clustering and correlation analyses. Thus, the remaining red pathways represent the real anatomical pathways in fronto-basal ganglia circuits.

