
Figure 3.
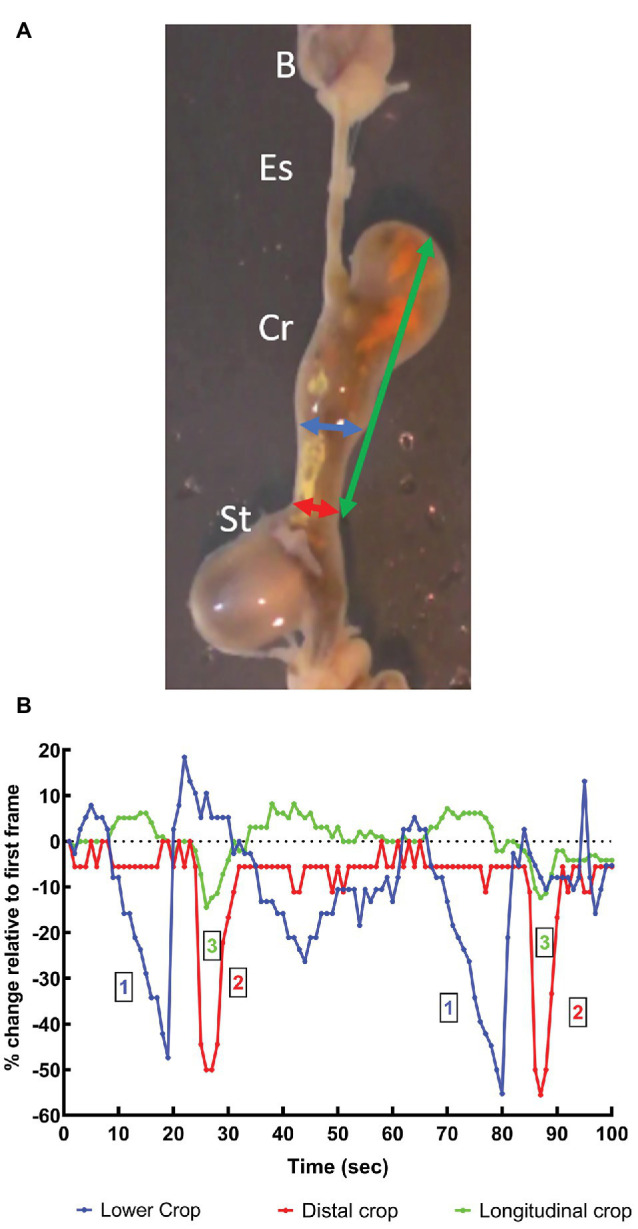
(A) Video frame showing the beak, esophagus, crop, and stomach in vitro (see above text for details) from an O. vulgaris fed a crab 1 h before killing. The vertical axis of the frame is ~8 cm. Arrows indicate the measurements made of the apparent diameter of the lower crop (blue), distal crop (red) at the crop-stomach junction and the length of the crop (green). B, beak; Es, esophagus; Cr, crop; St, stomach. (B) Measurements of the changes in the dimensions of the crop made in vitro from an animal fed a crab 1 h before killing. The measurements defined above are made each second from 100 s of video recording (see Figure 2) and show two cycles of contraction. All measurements are expressed as a percentage change relative to those taken at t = 1 s. The two contractile cycles closely duplicate each other ~1 min apart. The graph shows the wave of contraction of the lower-crop (1) passes to the distal crop (2). The contraction of the distal crop is accompanied by longitudinal shortening of the crop (3). Note that both the lower and distal crop change apparent diameter by ~50% during the passage of the peristaltic contraction.