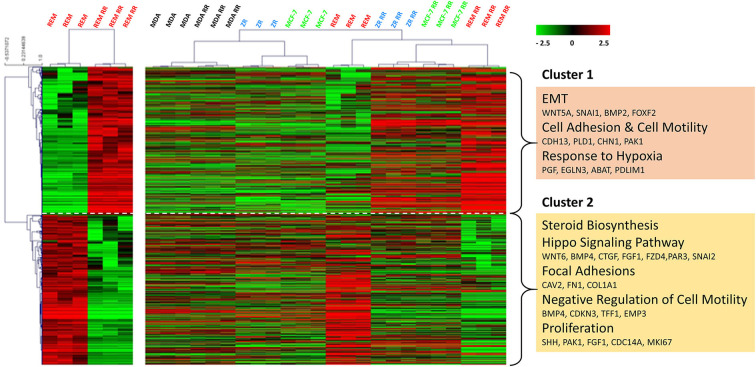
Figure 2.
Global gene expression changes between the canine and human parental and RR cell lines. Heatmap showing log2 mean-centered gene expression profiles between parental and RR cell lines in respect of differentially expressed genes (false discovery rate = 0.01). Differences between the REM-134 and REM-134 RR cell lines are shown in the heatmap on the left, and the expression of the same differentially expressed genes across all human and canine parental and RR cells are shown in the heatmap on the right. Heatmap clustering was carried out using Pearson correlation with average linkage; red = higher expression, black = no change, green = lower expression. The gene list and the order in which they appear in the heatmap are shown in Supplementary Table 2.

